


As of 02/20/2024 NY Market close, lagged net liquidity dips into 02/27 at least followed by a small bounce. The divergence remains large between liquidity and equities, so from a liquidity standpoint, the markets are overvalued. Let’s look at some other factors as well.
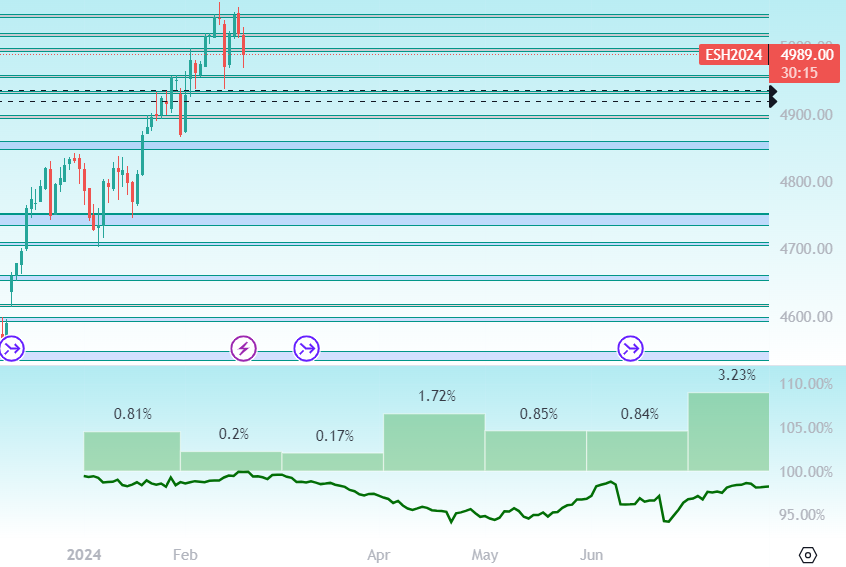
From a macro standpoint, we have seen back to back hot CPI and PPI prints which has put a dent in the Goldilocks bull thesis. It suggests the Fed will continue pushing for tighter policy than anticipated. Seeing this while markets are this elevated supports a bearish stance on equities currently. I am in line with this view as I still believe equities are flying too high from a macro standpoint as restrictive policy continues. Based on seasonality of presidential election years, we are also on the cusp of a bearish timeframe that can extend into April (Fig. 1 below). We have several fed speakers this week as well as minutes coming out. The idea of ample rate cuts is still very much a theme that bulls are holding onto. In order for the markets to truly put in a major top, this theme needs to continue to be killed via data and Fed talk. Based on the data we’re seeing this is what the Fed should do. If we see a phase of re-inflation the idea of another hike even being mentioned by speakers would tank the markets.
Let’s look at some technical indicators to see how my current positioning aligns.
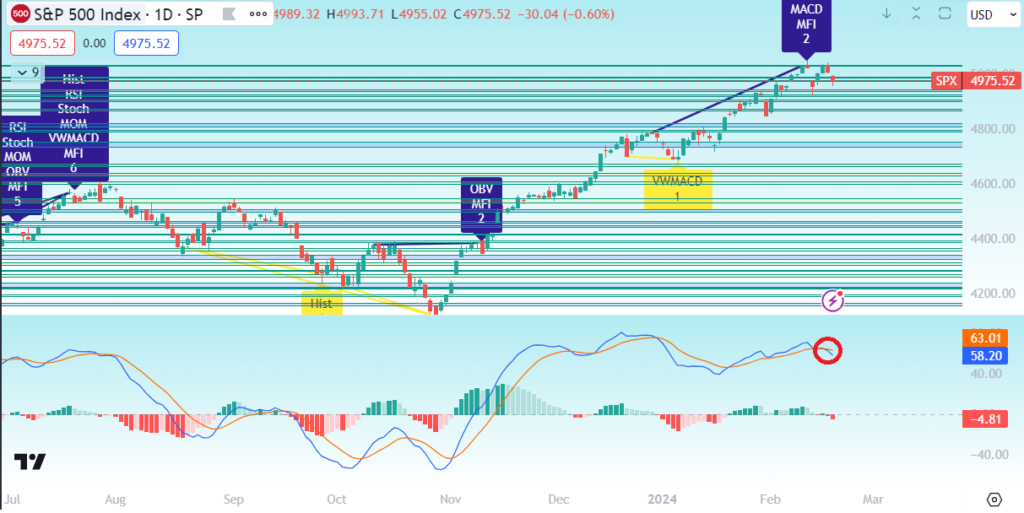

We see SPX’s run looking exhausted as the daily MACD flashes a bearish cross signal. You see the same above on the QQQ daily.

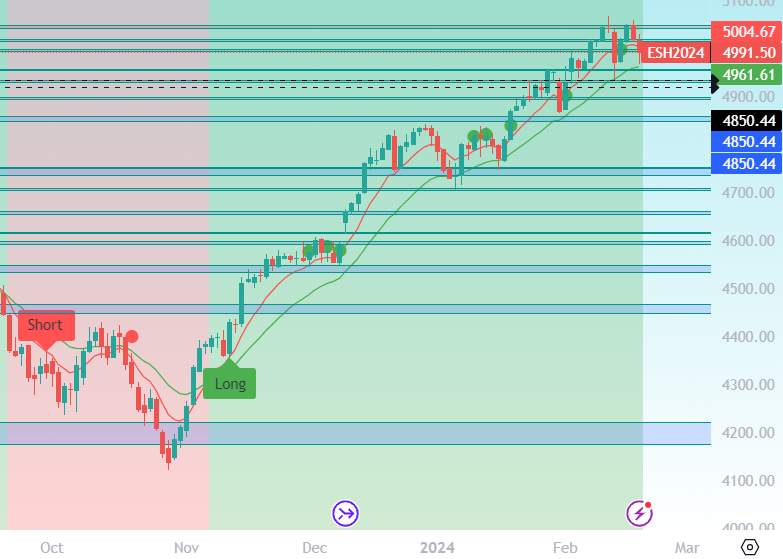
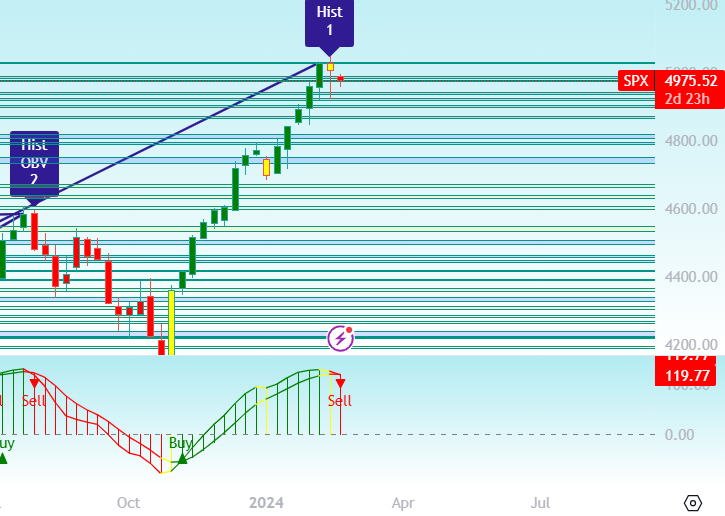
The TradeBeacon Trendbot remains on sell-mode on the hourly for ES. However, on the larger daily timeframe, we remain in an uptrend currently. Technically, we are fighting the daily timeframe trend by being short. If/when the daily also enters a sell signal, it would give me further confidence to increase far dated options shorts on equities. If this daily sell were to trigger, it would signal a larger degree pullback into the ~4500 or lower ES range.
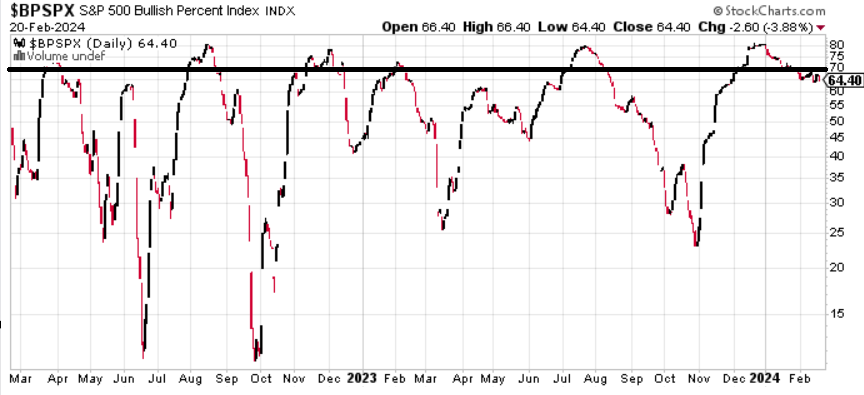
The SPX bullish percentage index remains on a sell as it stays below 70 after crossing above. This has almost always led to significant pullbacks in the past.
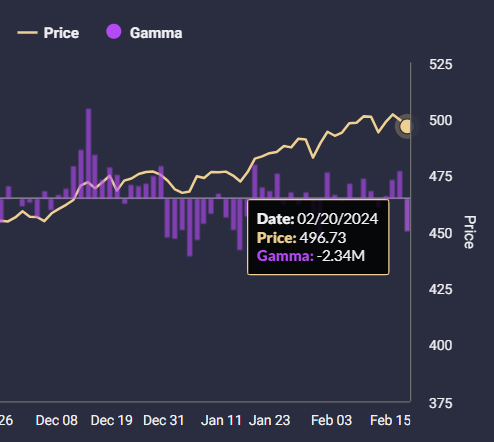
We are in negative gamma territory after today’s close which makes the market more susceptible to further drops. In a negative gamma situation, market makers are forced to sell more of the underlying asset to hedge their positions, potentially accelerating the downward movement of the market. This can create a feedback loop that drives prices lower, contributing to bearish sentiment.

Fear and Greed index remains extremely elevated and continues to suggest that it’s risky to remain long. We are at an area that have signaled major sell-offs in the past, as there is still too much froth left in the market.
From a zone standpoint, SPY is sitting above the 495.58-496.07 support level. This level is weak and the only significant support remains $13 lower at 482.74-483.05, followed by $480. Structure remains weak while several indicators point to am imminent pullback. Being in negative gamma puts the markets further at risk of an accelerated pullback. We see the weekly bearish divergence from last week has stuck suggesting a multi-week pullback ahead. We also see the RSI/TSI overbought/oversold indicator flashing a sell signal now for a multi-week pullback. I remain in my short position of 23 ES shorts, 7 NQ shorts, 1 SPX put, 10 QQQ puts.
Commodities
I took profit on my gold shorts and oil longs as well as most of my TN shorts, all of which were very profitable. I continue to hold some small TN shorts for continuation. I also continue to hold 50% of my Oats longs with a 362.5 average entry price (and still looking to re-accumulate the Oat longs I took profit on). I will also re-long oil if/when we see one more flush down in price. My reasonings for these trades has not changed. See below.
Based on the SPR acquisition schedule, SPR is buying and there are also refinery outages which suggest oil is/has put in a multi month bottom. I plan to continue to add more oil longs on pullbacks, but I am hoping on a major flush to really load the boat.
The TN and Gold shorts are based off my thesis that bonds will continue to get shut down due to the delta between bill rates and RRP rate growing, along with energy pricing rising which will also have a lagged positive impact on yield. Gold had an exasperated sell-off along with TN last week which gave me a nice win to take profit on. I do think more downside is ahead but I’m biding my time for a re-entry.
My Oats longs are based off the fact that the acres being planted has decreased by over 10% while demand is strongly growing. There is just not enough of it and price will reflect this by rising higher. World production of oats is predicted to fall to a multi-year low. Canada is also set to produce sharply lower due to drought. We see the same theme in EU and Australia. This trade to me seems like a no-brainer and I’m willing to bet big on it. I am still in 28 contracts long after taking profit on half due to a sharp, quick rise. I am looking to build out multi-month bull position though so I’m looking to add on dips.

Intra-day Trade Recaps/Analysis (Coming soon)
As always, please manage your own risk and sizing.. I can only share what I am doing with my own account.
Disclaimer: The information provided in this post is for educational and informational purposes only and does not constitute financial advice, investment advice, trading advice, or any other form of professional advice. The author is not a registered investment advisor, broker-dealer, or financial planner. No content published here should be interpreted as a recommendation to buy, sell, or hold any security or financial instrument.
All investments and trading strategies involve risk, including the possible loss of principal. Past performance is not indicative of future results. You should conduct your own research and consult with a licensed financial professional before making any investment decisions. The author expressly disclaims any liability for any loss or damage arising from reliance on the information contained herein.