Market Roadmap / Insights (03/10/2026)
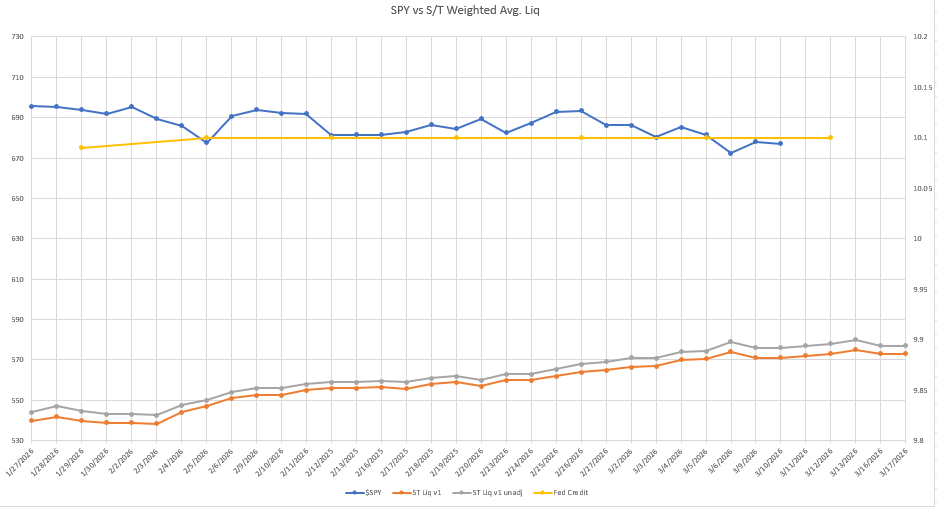
As of 03/10/2025 NY Market close, liquidity rises into 03/13 before declining a bit and leveling off. Liquidity remains supportive of the markets but the geopolitical space is causing volatility.
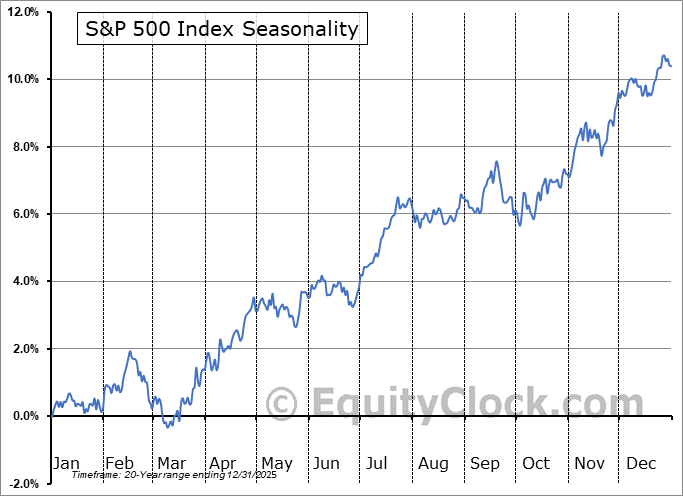
Since the last roadmap, $SPY fell significantly due to escalation in Iran combined with Trump’s provocative headlines, but then bounced right back after Trump said the war should be over soon. We took advantage of this dip in a big way by making a significant bet on $VIX reversing by shorting $UVXY and longing $SVIX (again). This paid me handsomely, especially with the sizing I used. Hopefully, you were able to follow along and take advantage. I believe that once the middle eastern turmoil subsides, there won’t be much preventing the market from finally entering a leg higher to new ATHs. $SPY has remains in the same range for many months now and is due for a large move. We do have CPI coming tomorrow which will lead to near term price swings. I give my prediction on CPI at the end of this document. Seasonality will also be flipping to very bullish within a few days which will serve as a tailwind for equities. I remain long with a focus on tech.
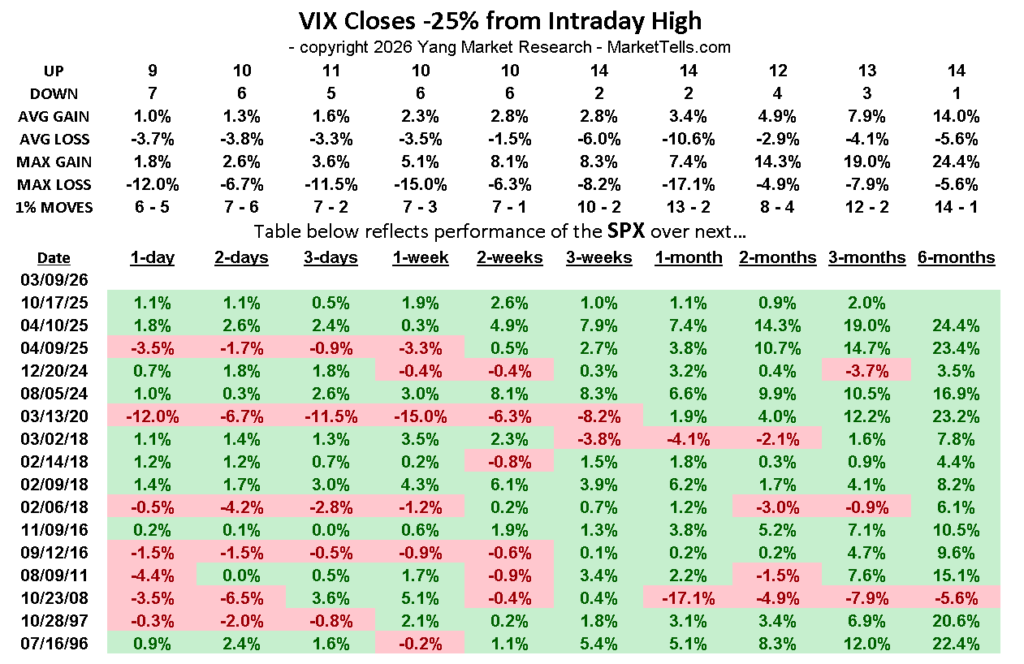
Such a significant drop in $VIX from highs has led to a very bullish performance for $SPX when looking forward 1+ month.
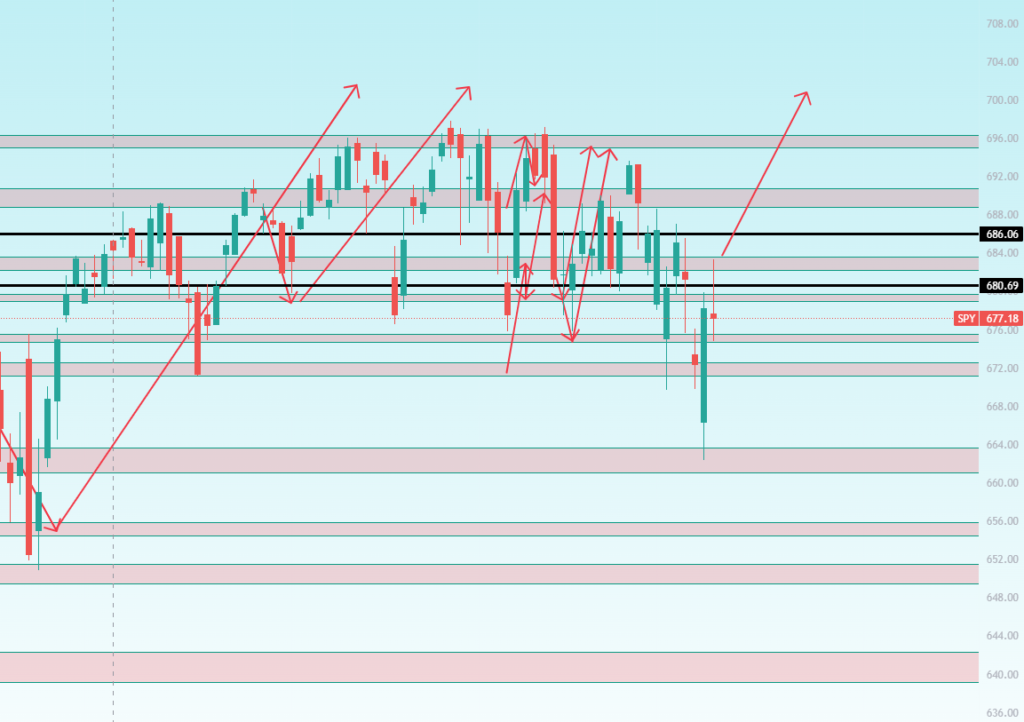
I’d still like a daily close above the $684 area zone for $SPY, which should trigger a quick move higher. Regardless, I remain bullish.
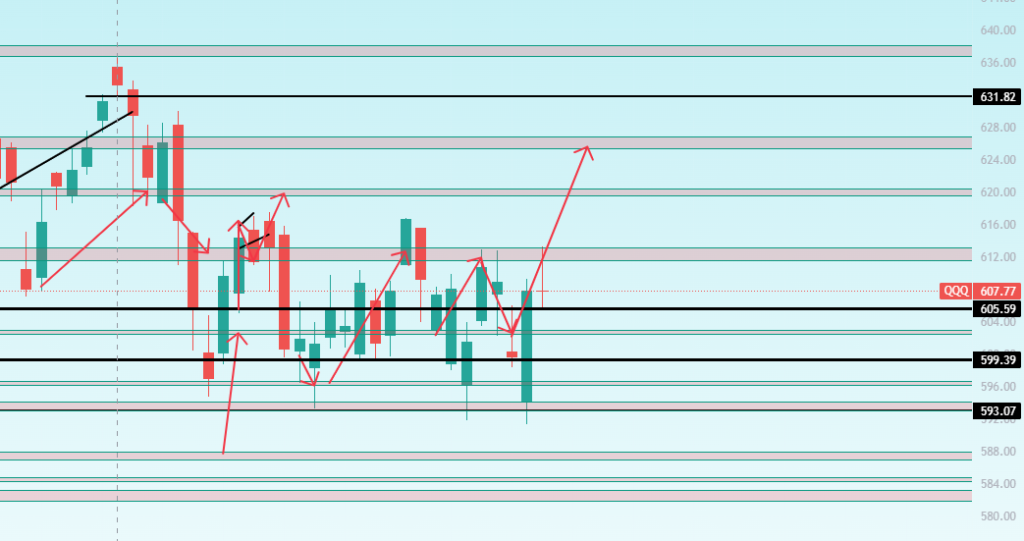
Similar view for $QQQ. It needs a daily close above the $612 area zone still but I remain bullish overall.
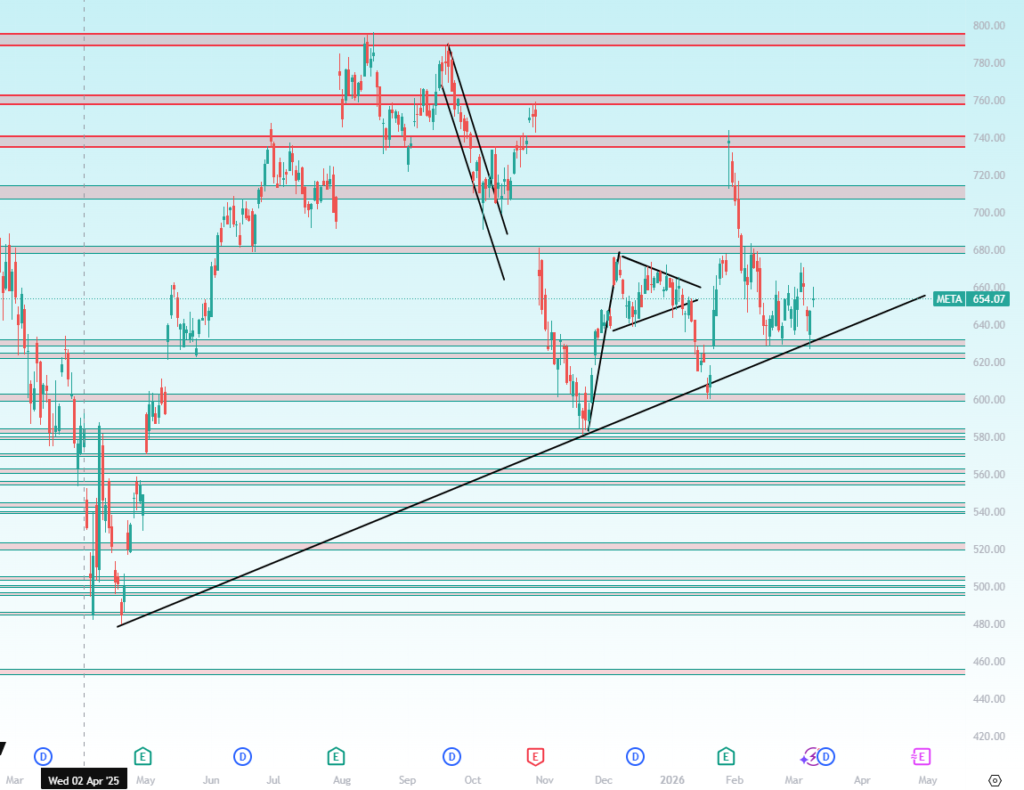
$META = Great Spot to Buy!
$META is not only trading at a cheap P/E, historically, but is also at a great technical buy spot IMO. It is bouncing off a long term trendline and has plenty of solid support below current levels.
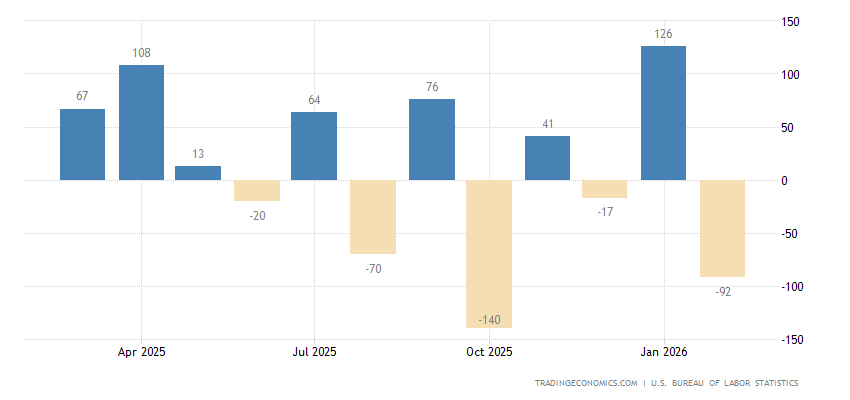
NFP Shock: Economy LOST 92,000 Jobs in February (03/06)
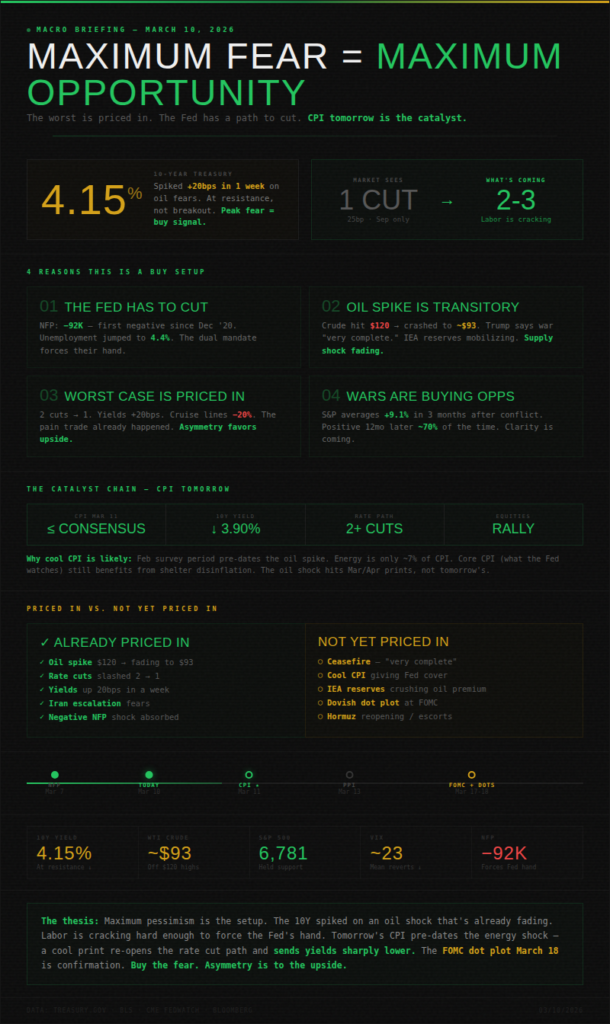
Friday’s jobs report was the story of the week. Nonfarm payrolls came in at NEGATIVE 92,000 vs the +50,000 expected — a 142K miss and the 3rd negative print in the last 5 months. Unemployment rose to 4.4%. Healthcare lost 28K (Kaiser Permanente strike sidelined 30,000+ workers). Federal government employment fell another 10K as the Trump admin continues its workforce purge (federal payrolls now down 330K or 11% since Oct 2024). Transportation/warehousing lost 11K. Manufacturing shed 12K. The only bright spot was wage growth holding firm at +0.4% MoM. This report confirms what we have been saying: the labor market is cracking. The good news? This gives the Fed the ammunition it needs to cut rates. The bad news? Combined with oil above $90, this is textbook stagflation risk — and the S&P dropped 1.3% on Friday as “stagflation” became the word of the day on Wall Street.
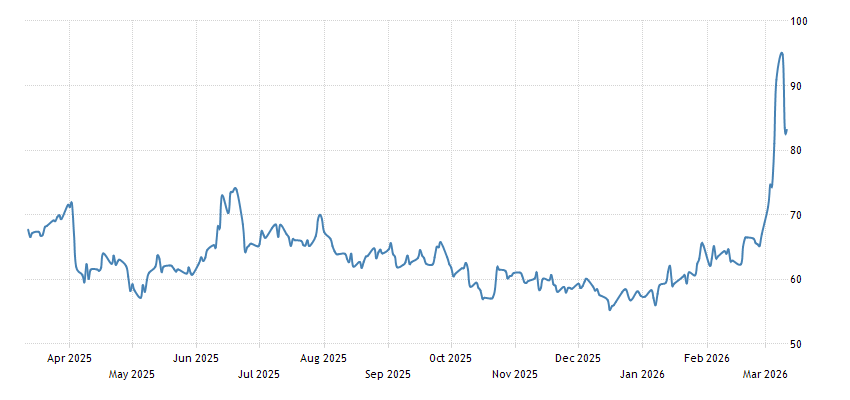
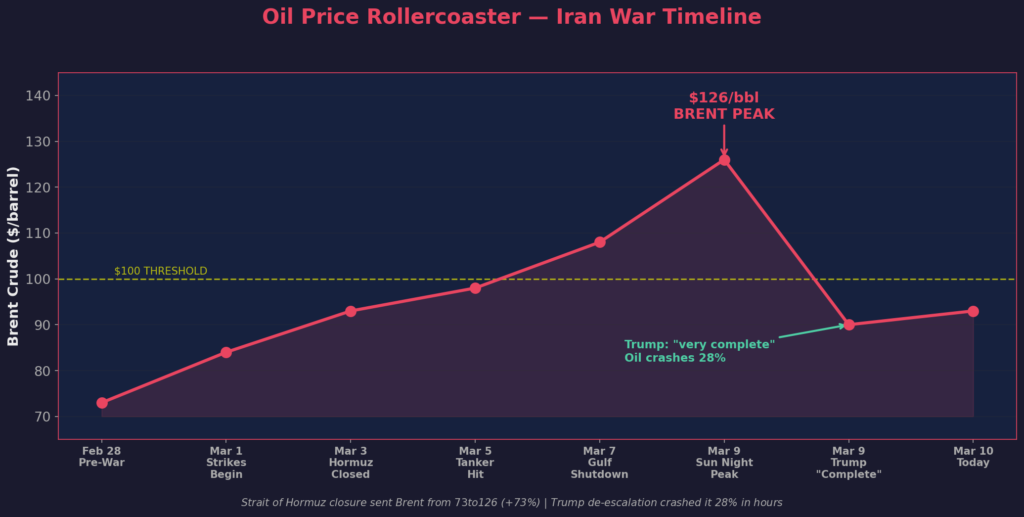
Oil Hits $126/Barrel — Then Crashes 25% in 24 Hours (03/07-03/10)
The oil market went absolutely haywire this weekend. On Sunday night, Brent crude breached $100 for the first time in 4 years and kept ripping to $126/barrel as Gulf countries began shutting down production because they literally cannot export through the closed Strait of Hormuz. WTI briefly topped $119. Then the reversal: Trump told CBS on Monday that “the war is very complete, pretty much” — and oil plummeted. WTI settled at $94.77 on Monday, then crashed further to $86.47 after hours (-8.76%). Brent settled at $98.96, then fell to $89.58 (-9.5%). By Tuesday (today), oil is hovering around $86. The whipsaw was intensified by Energy Secretary Chris Wright falsely claiming the Navy had escorted a tanker through Hormuz — the White House had to correct him (“The U.S. Navy has not escorted a tanker or a vessel at this time”). Despite the drop from $126, oil is still up ~30% since the Iran conflict started. If Hormuz reopens, oil crashes back to $70s. If it stays closed, $100+ is the floor. This is THE binary macro trade right now. I personally think a long term short on oil here will pay.
Iran War Update: Day 11 — Trump Says “Very Complete” (03/07-03/10)
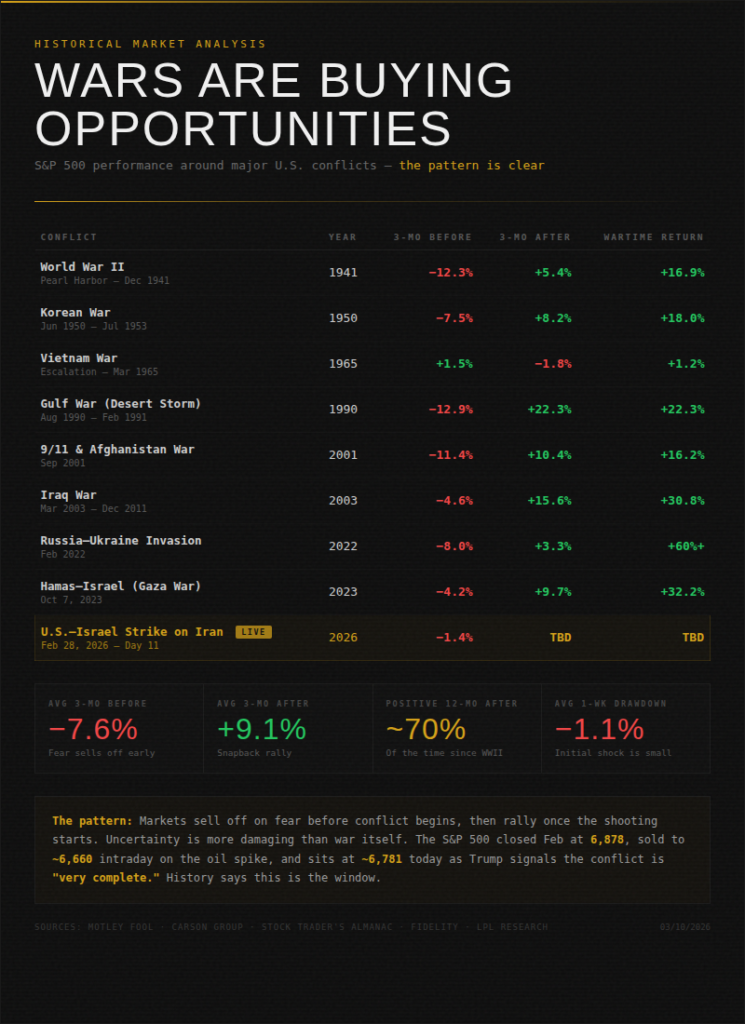
The US-Iran conflict is now in day 11. The Strait of Hormuz remains effectively closed with tanker traffic at near zero. P&I insurance is still pulled. But the tone is shifting. Trump’s comments on CBS Monday that the operation is “very complete, pretty much” was the first real de-escalation signal. He also said the Navy would escort ships “if necessary, as soon as possible.” The market clearly WANTS to believe de-escalation is coming — look at how violently oil reversed from $126 to $86 on just Trump’s comments alone. No actual ceasefire has been announced. No tanker has been escorted. But the market is starting to price in resolution. This is exactly the setup I have been describing: war-related dips are buying opportunities. The moment a ceasefire is announced or Hormuz reopens, we get a massive risk-on rally and oil collapses back to the $70s. I shorted $UVXY again on Monday’s spike and it paid immediately.
Market Recap: The Wildest 3 Days of 2026 (03/07-03/10)
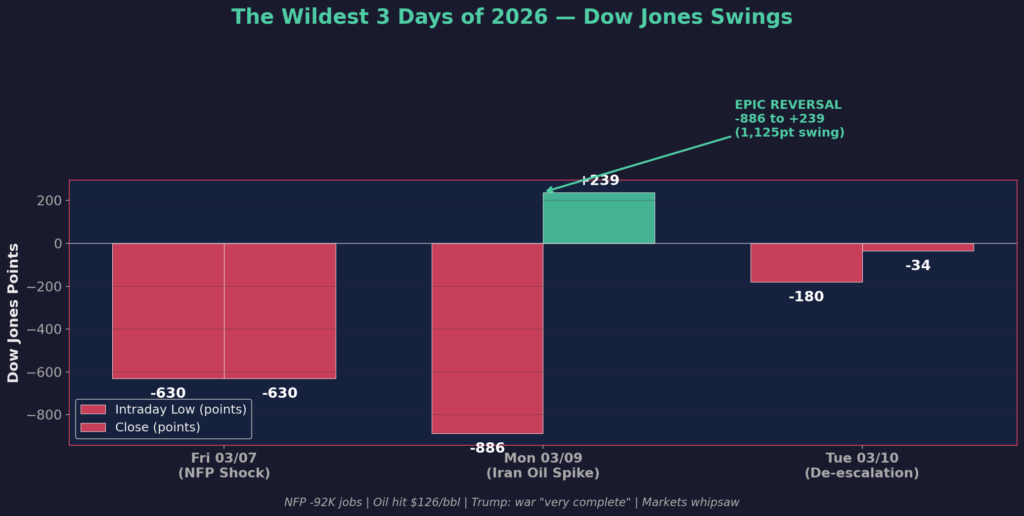
Friday (03/07): S&P 500 dropped 1.3% as the toxic combo of negative NFP (-92K) and oil surging above $90 triggered stagflation panic. Risk-off across the board.
Monday (03/09): One of the most volatile days in years. Oil briefly hit $119 overnight. The Dow plunged 886 points at the lows. Then Trump said the war was “very complete” on CBS — oil crashed, and the entire market reversed. Dow closed +239 points (+0.5%). S&P 500 +0.5%. Nasdaq +1.3%. The intraday range on the Dow was over 1,100 points. This kind of reversal from extreme lows is historically very bullish — it shows there is massive demand waiting to buy dips.
Tuesday (03/10 — today): Mixed and muted after yesterday’s wild ride. S&P 500 -0.21% to 6,781.48. Dow -34 points (-0.07%) to 47,706.51. Nasdaq +0.01% to 22,697.10. Oil continued retreating to ~$93. Chip stocks rallied on strong TSMC sales data — $NVDA +1.2%, $MU +3.5%, $INTC +2.6%. Nine of 11 S&P sectors closed lower with energy leading declines as oil pulled back. The market is now in a holding pattern ahead of tomorrow’s CPI report.
10-Year Treasury & Rate Cut Expectations
The 10-year yield has climbed to 4.15%, its highest level in a month, as the oil spike reignited inflation fears. Here is the problem: traders have now repriced to expect only ONE 25bp rate cut this year (most likely September), down from TWO cuts expected just a week ago. The Fed is in a difficult position — the labor market is cracking (NFP -92K, unemployment 4.4%) which argues for cuts, but oil-driven inflation is spiking which argues against cuts. This is the classic stagflationary bind. I do believe the oil spike will be very short lived though. I believe the CPI data tomorrow will be a big data point too. A cool print gives the Fed cover to cut and sends yields lower. A hot print combined with $93 oil locks them in place and keeps yields elevated. The FOMC meets March 17-18 and the updated dot plot will be critical for understanding the 2026 rate path.
Commodities
GOLD
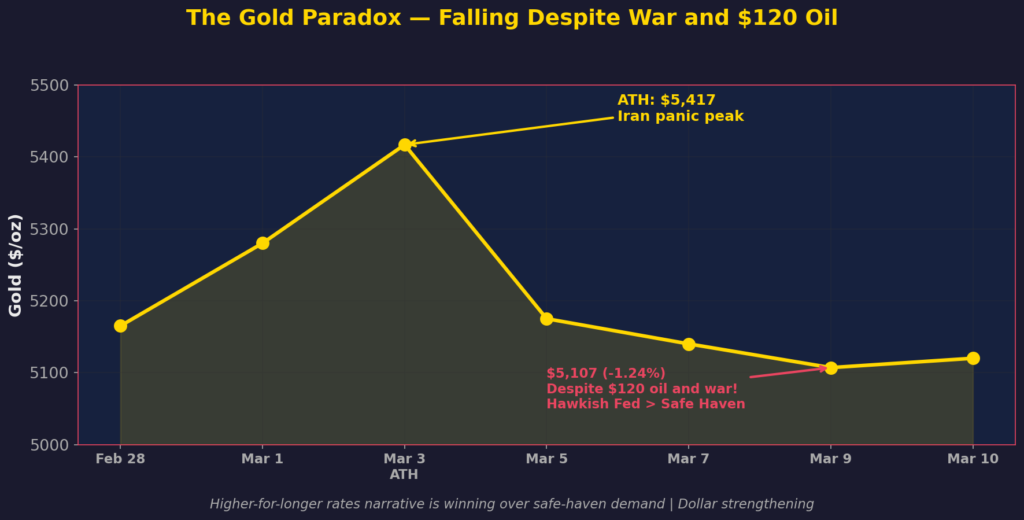
Gold actually FELL 1.24% on Monday to settle at $5,107 despite oil at $120 and a literal war. This is the safe-haven paradox: the dollar strengthened and rate cut expectations collapsed (only 1 cut priced in now vs 2 a week ago), which increased the opportunity cost of holding non-yielding gold. The “higher-for-longer” rates narrative is winning over the safe-haven narrative. Gold is now stuck between two forces — geopolitical fear pulling it up and hawkish Fed repricing pulling it down. Goldman Sachs and J.P. Morgan still have year-end targets of $6,000-$6,300. I continue to expect gold to pull back to the low $4,000s once Iran resolves and the geopolitical premium unwinds. Today gold is trading around $5,100-$5,120.
OIL
As covered above, oil had a historic week. Brent hit $126 at the peak (Sunday), WTI topped $119. Then crashed 25%+ in 24 hours on Trump’s de-escalation comments. WTI now at ~$93, Brent at ~$93. The Strait of Hormuz is still closed but the market is starting to price in resolution. Every $10 in oil adds roughly 0.3-0.4% to headline CPI, so even at current levels ($93 vs pre-war $70), we are looking at a ~0.7% inflation hit. This is why CPI tomorrow matters so much. If the February data (before the oil spike) comes in cool, the market can look through the oil shock as temporary. If it comes in hot, combined with oil at $93, the market may believe we have a real inflation problem.
Crypto
$BTC pulled back from last week’s $72K+ levels to around $67,700 on Friday as the NFP shock and oil spike hit all risk assets. The sell-off was relatively contained compared to equities — BTC dropped ~6% vs the S&P’s 1.3% on Friday. Over the weekend, BTC bounced to ~$69K as Trump’s de-escalation comments lifted sentiment. Today it is trading around $68,500. The $75K resistance level remains the key hurdle. The broader crypto complex is in wait-and-see mode ahead of CPI and FOMC. The Clarity Act (stablecoin legislation) continues to move through Congress which is a medium-term positive. I remain cautiously long but acknowledge that BTC is unlikely to break out until the Iran/oil situation resolves and rate cut expectations stabilize.
Key Catalysts Coming Up
This Week
- 03/11 (Wednesday) — February CPI data release at 8:30 AM ET. This is THE most important number before the FOMC. January CPI was +0.2% MoM / 2.4% YoY. After the hot PPI (0.5% MoM), hot PCE, and now oil above $90, expectations are elevated. A cool print = massive relief rally and rate cut hopes revive. A hot print = 10-year yield spikes above 4.25% and the “stagflation” narrative goes into overdrive. This is the data point that could break the market out of its range in either direction.
- 03/12 (Thursday) — February PPI data release. Will show producer-level inflation trends. Important for confirming or contradicting the CPI signal.
Next Week
- 03/17-18 — FOMC Meeting + Press Conference + Updated Summary of Economic Projections (SEP). March cut probability is near zero. The market now expects only 1 cut all year (September). The dot plot and Powell’s commentary on the dual-mandate conflict (weak jobs vs oil inflation) will set the tone for Q2. Powell’s term ends in May and Kevin Warsh has been nominated as his successor — this may be one of Powell’s final meetings as chair.
- Iran/Hormuz Resolution — Trump said the war is “very complete, pretty much.” If a ceasefire materializes this week, oil crashes to the $70s, the VIX collapses, and we get a massive risk-on rally. This remains the single biggest binary catalyst for global markets.
- Trump-Xi Summit — Still being planned for late March/early April. Any tariff rollback would be an additional bullish catalyst on top of Iran resolution.
Bottom line: We just lived through the most volatile 3 days of 2026 and I am MORE bullish, not less. Here is why: (1) Monday’s intraday reversal from -886 on the Dow to +239 was one of the most powerful bullish signals you can see — massive demand waiting to buy any dip. (2) Trump’s de-escalation comments suggest the Iran operation is nearing its end, which means the oil premium unwinds soon. (3) The NFP at -92K gives the Fed the cover to cut once inflation data allows it. (4) ISM Manufacturing (52.4) and Services (56.1) both expanding confirms the economy is NOT in recession despite the jobs weakness. (5) Chip stocks are rallying on TSMC data confirming the AI spending cycle is intact. The setup is exactly what I described last week: maximum fear = maximum opportunity. I shorted $UVXY on Monday’s spike and it paid. I am adding to $SVIX. I continue to hold my big tech longs. CPI tomorrow is the next catalyst. Stay patient. Stay long. Buy the fear.
CPI Outlook
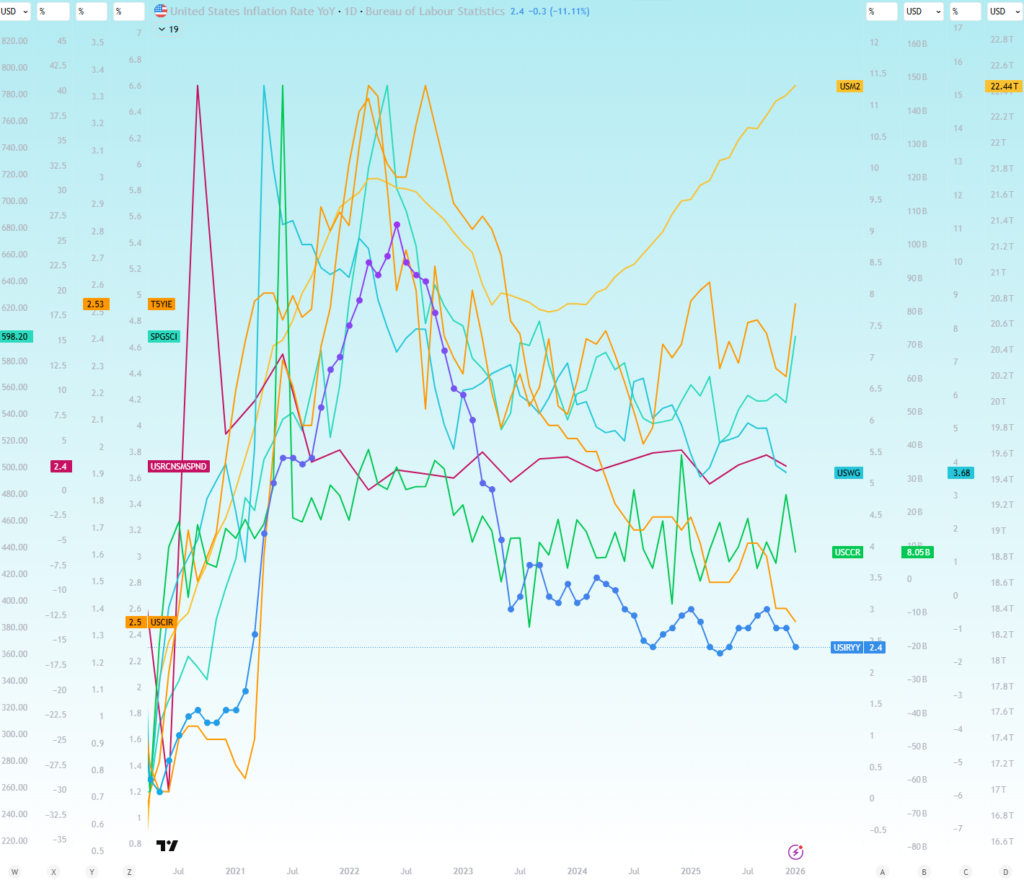
The expectations for CPI are YoY headline CPI coming in at 2.4% (vs. 2.4% last month) and core CPI YoY coming in at 2.5% (vs. 2.5% last month). The MoM readings are expected to rise at 0.3% for headline and 0.2% for core. Overall, inflation is expected to remain the same YoY, rise slightly for MoM headline and decline slightly for core MoM. My prediction for CPI was spot on again last month. Let’s see if we can again do the same. I believe headline CPI will come in right around the same as last month (and match expectations), and core CPI will slightly cool YoY as well as MoM (0.1% below expectation for YoY, and right at expectation for MoM). Although we do see a rise in oil prices, I don’t think the recent spike will be reflected in this month’s readings and the other leading metrics actually show cooling. Overall, I expect the equity reaction to be relatively flat. If a dip is provided off my expected reading, it should be an opportunity to long.
- The United States M2 is still rising having an upward effect on CPI.
- Commodity + Energy price index have risen which will have an upward effect on CPI (but the majority of this won’t reflect in February’s reading).
- US Consumer Credit is down which will have a cooling effect on CPI.
- US Consumer Spending is slightly down which will have a cooling effect on CPI.
- 5 Year Expected Inflation has risen but has minimal impact on CPI currently.
- Wage growth has continued to fall which will have a cooling effect on CPI.
- Overall, I believe the degree of changes on these metrics will lead to a minimally downward effect primarily on core CPI. I expect us to land right at expectation for headline, and slightly below expectation for core YoY.
I expect the overall impact on equities to be pretty neutral but if we do fall off the numbers I expect, it should be an opportunity to long.
Disclaimer: The information provided in this post is for educational and informational purposes only and does not constitute financial advice, investment advice, trading advice, or any other form of professional advice. The author is not a registered investment advisor, broker-dealer, or financial planner. No content published here should be interpreted as a recommendation to buy, sell, or hold any security or financial instrument.
All investments and trading strategies involve risk, including the possible loss of principal. Past performance is not indicative of future results. You should conduct your own research and consult with a licensed financial professional before making any investment decisions. The author expressly disclaims any liability for any loss or damage arising from reliance on the information contained herein.