Technical Glance (03/29/2026)
Every major technical indicator is screaming oversold right now. Below is a breakdown of charts and data from the past 3 days (03/27-03/29) — all pointing to an imminent bounce. Charts sourced from Navigating the Market, SNP Edge, Robert Sinn (Charts of the Week), ChartsAreFun, and ChartStorm.
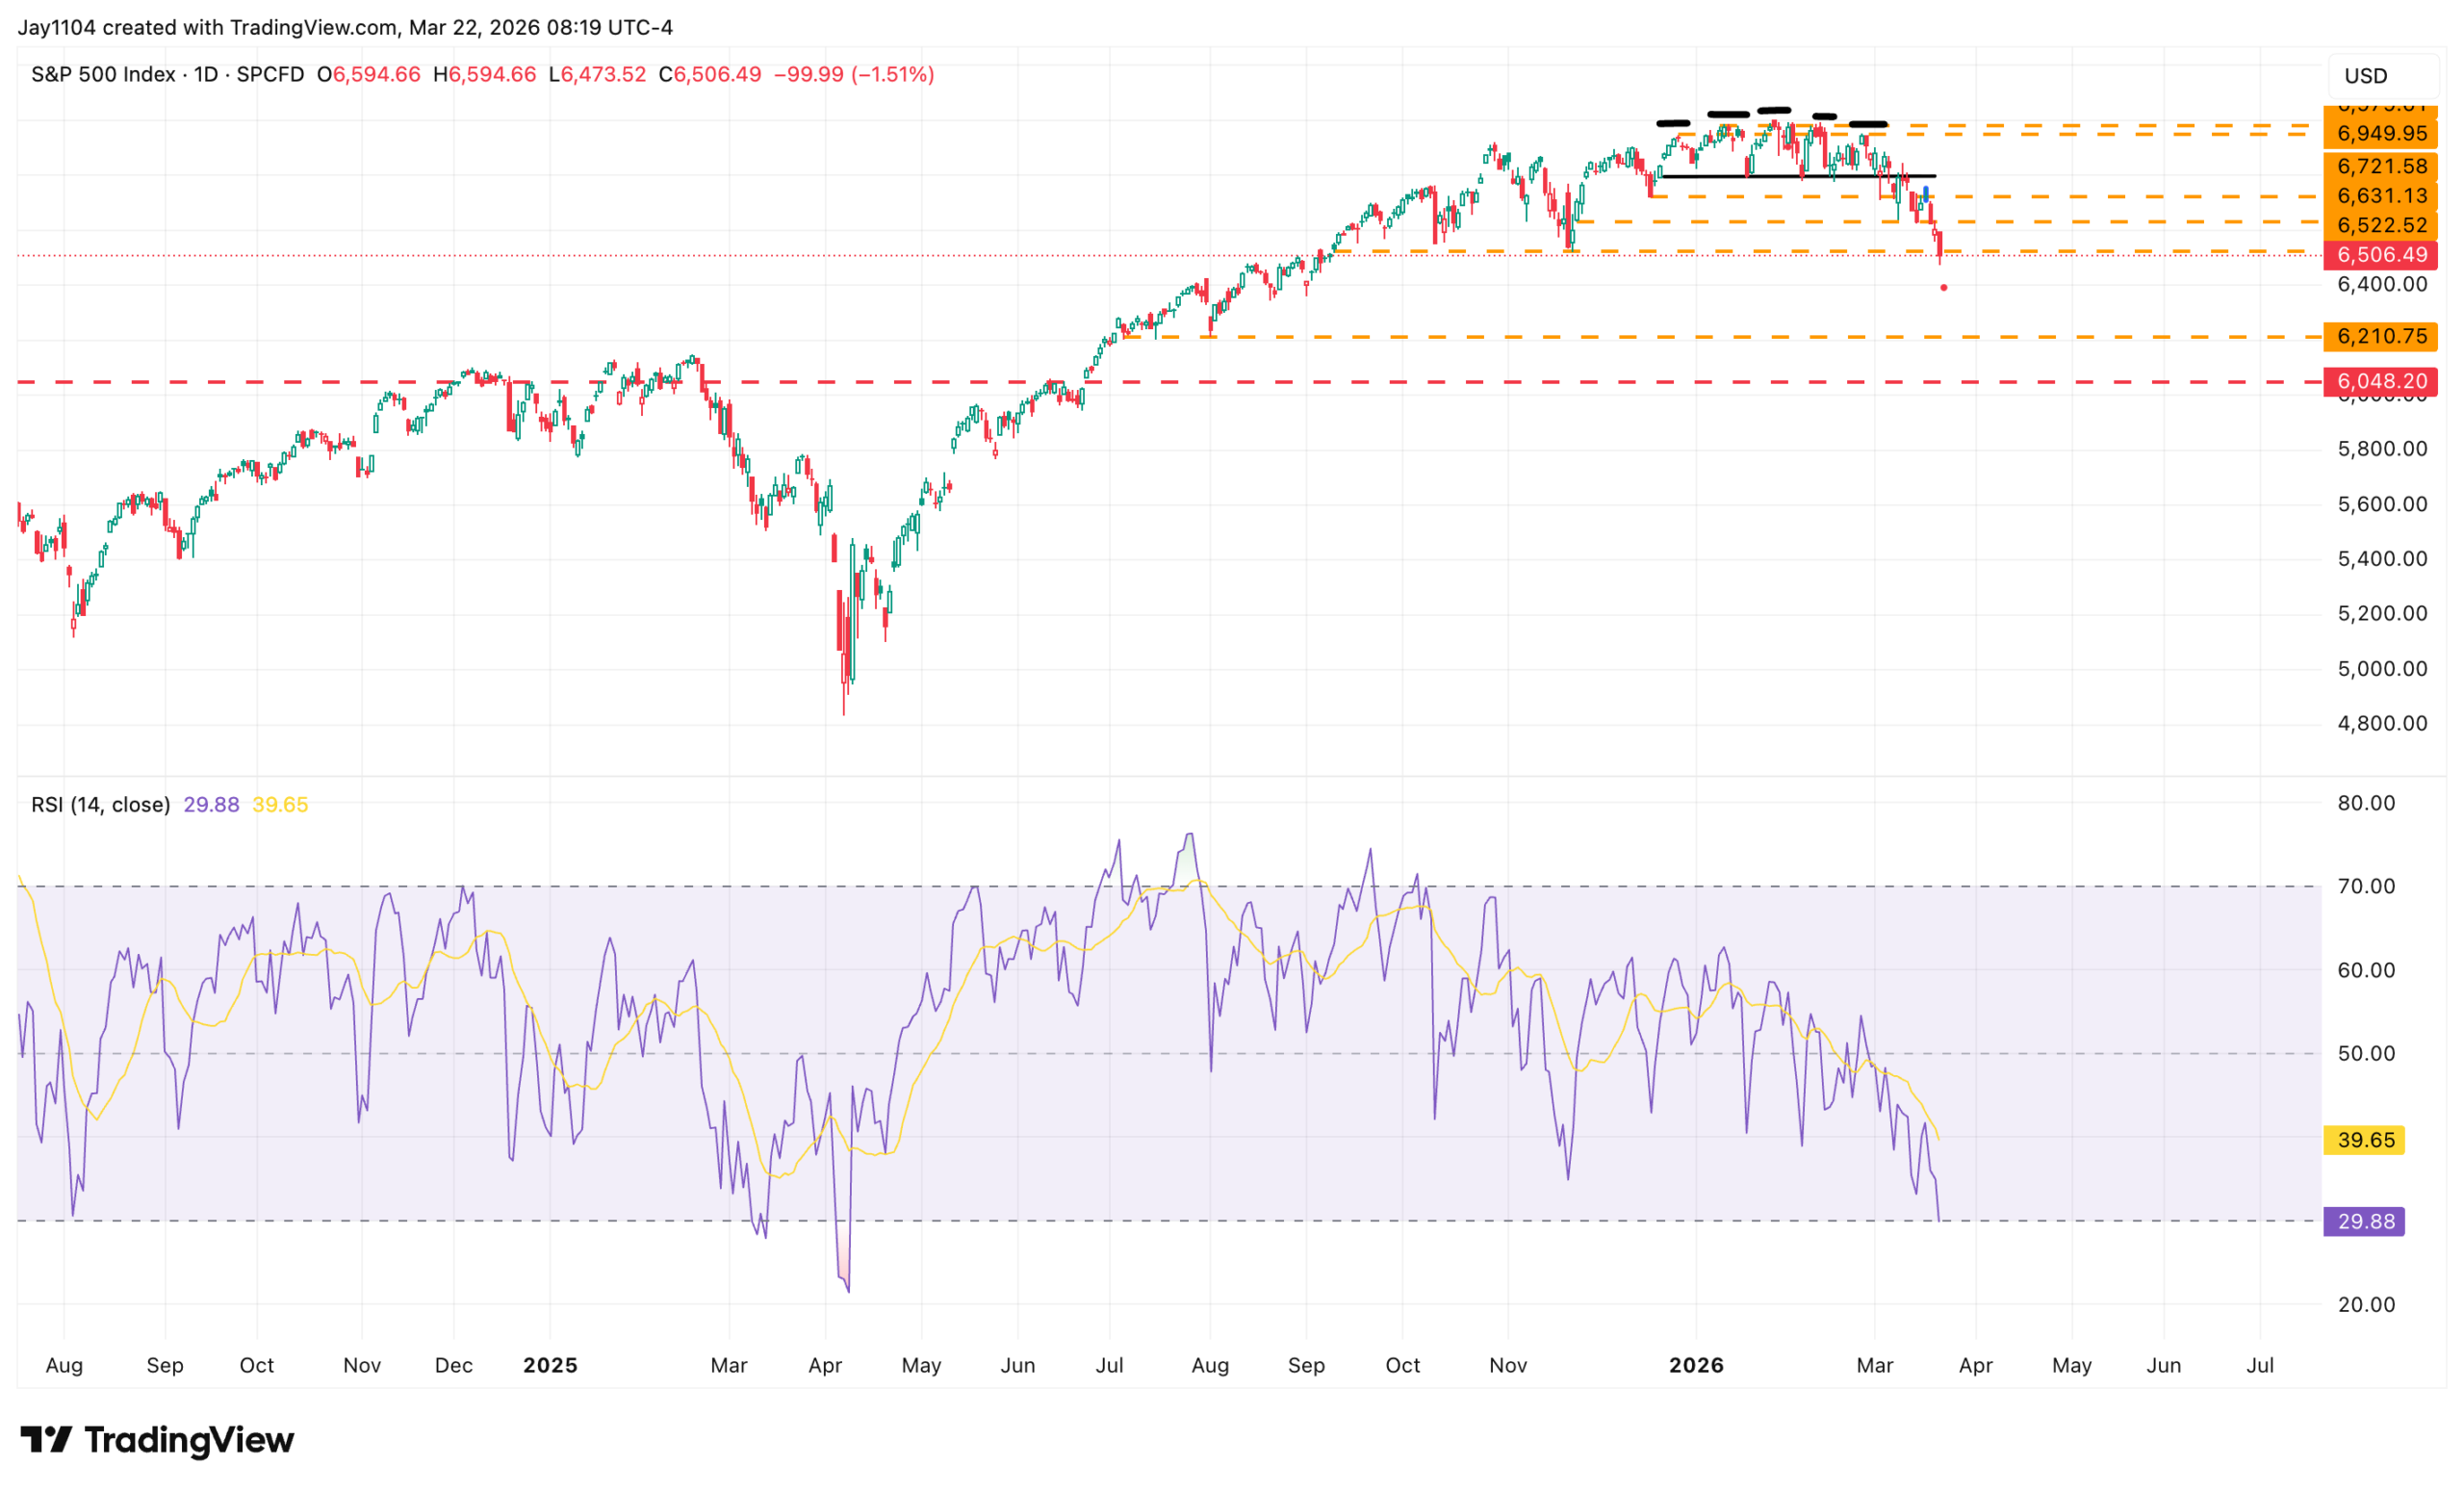
1. S&P 500 Oversold Signal — Below Lower Bollinger Band, RSI Below 30
The S&P 500 is trading below its lower Bollinger Band with the 14-day RSI below 30 — a dual oversold signal that has an 85%+ hit rate for a positive 1-month return since 2010. The current SPX RSI reading is 22.1, the lowest since October 2022. As Navigating the Market noted: “The S&P 500 looks oversold on a technical basis” — this is the kind of technical extreme that precedes sharp bounces.
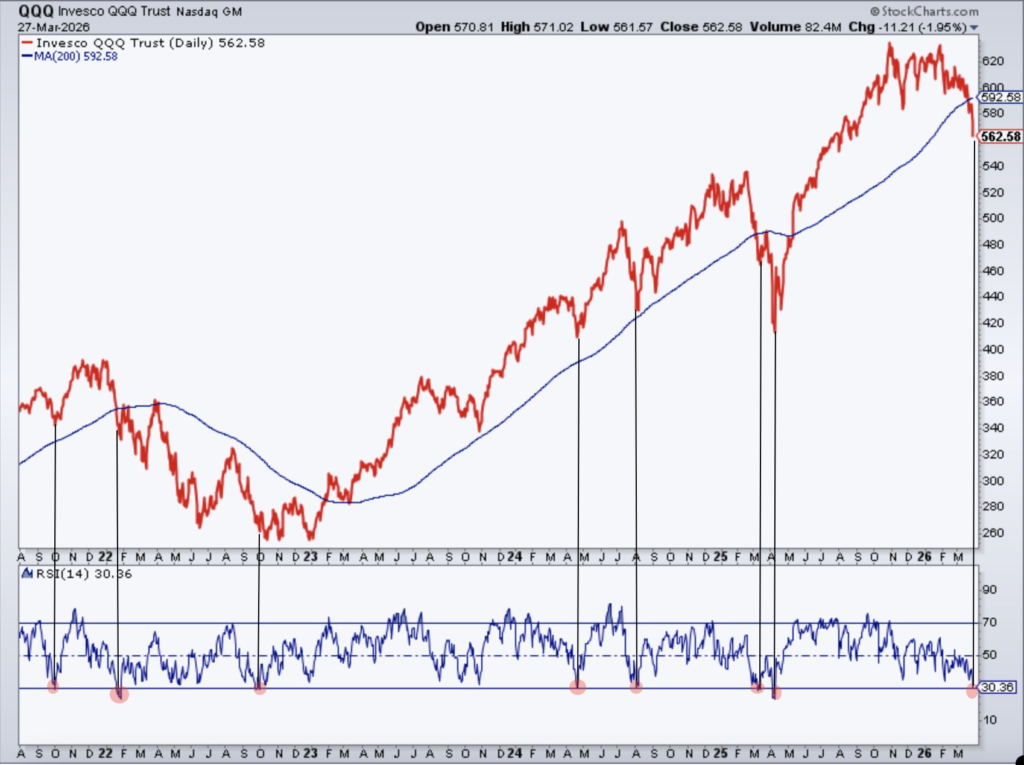
2. NASDAQ Majorly Oversold
$QQQ is very oversold on the daily. This level of oversold has led to bounces in the past.
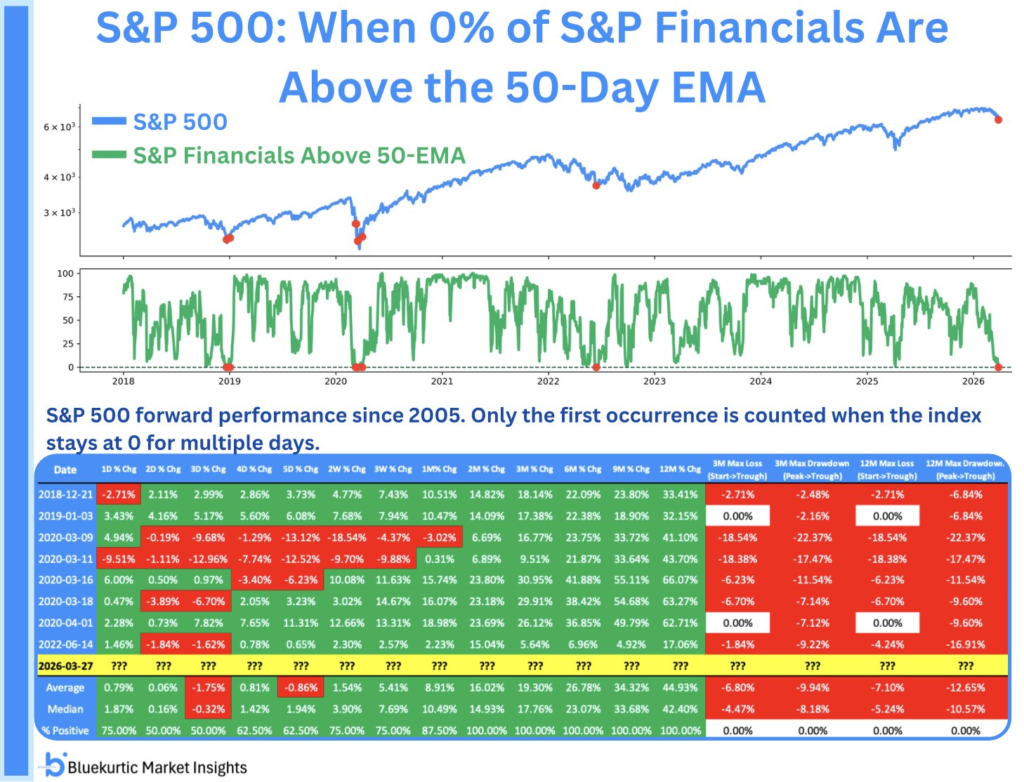
3. Financials Extremely Oversold
Financials are at an oversold level only seen a handful of times. This remains an opportunity.
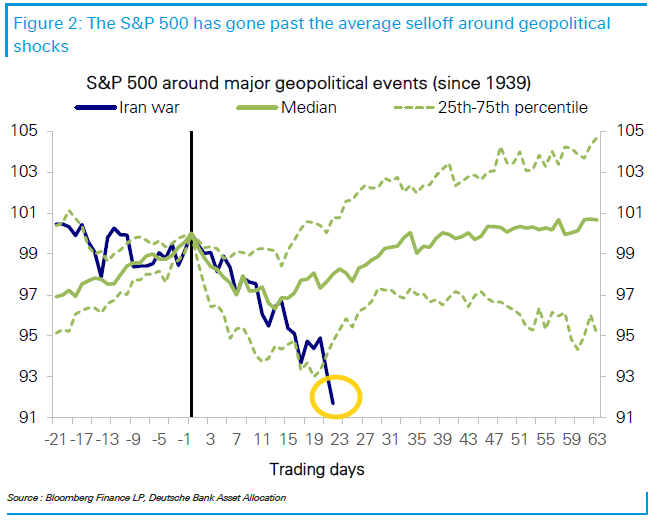
4. Goldman Sachs — S&P 500 Recovery After Geopolitical Shocks (03/29)
Goldman Sachs’ equity sentiment indicator dropped to -0.9 — one tick from the -1.0 level that is “historically predictive of above-average equity returns.” Their chart shows S&P 500 performance following major geopolitical shocks throughout history. The pattern is clear: the market ALWAYS recovers and moves higher. Iran is no different. As Robert Sinn noted: “a deeply oversold equity market with Q1 earnings approaching creates conditions for a strong rebound.”
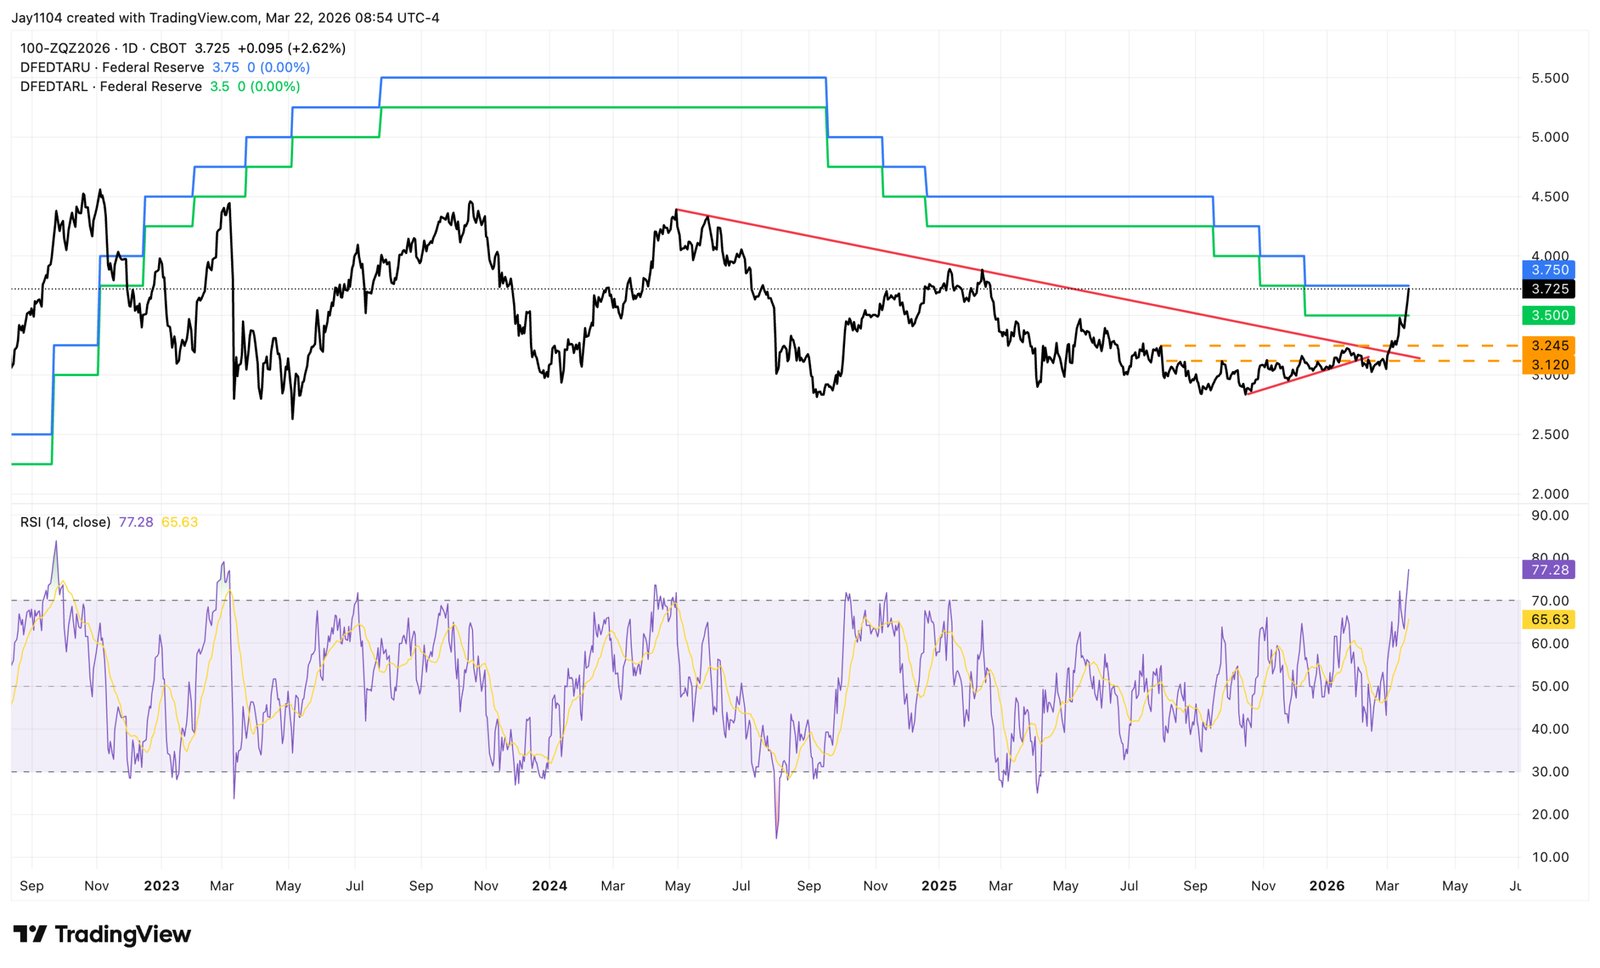
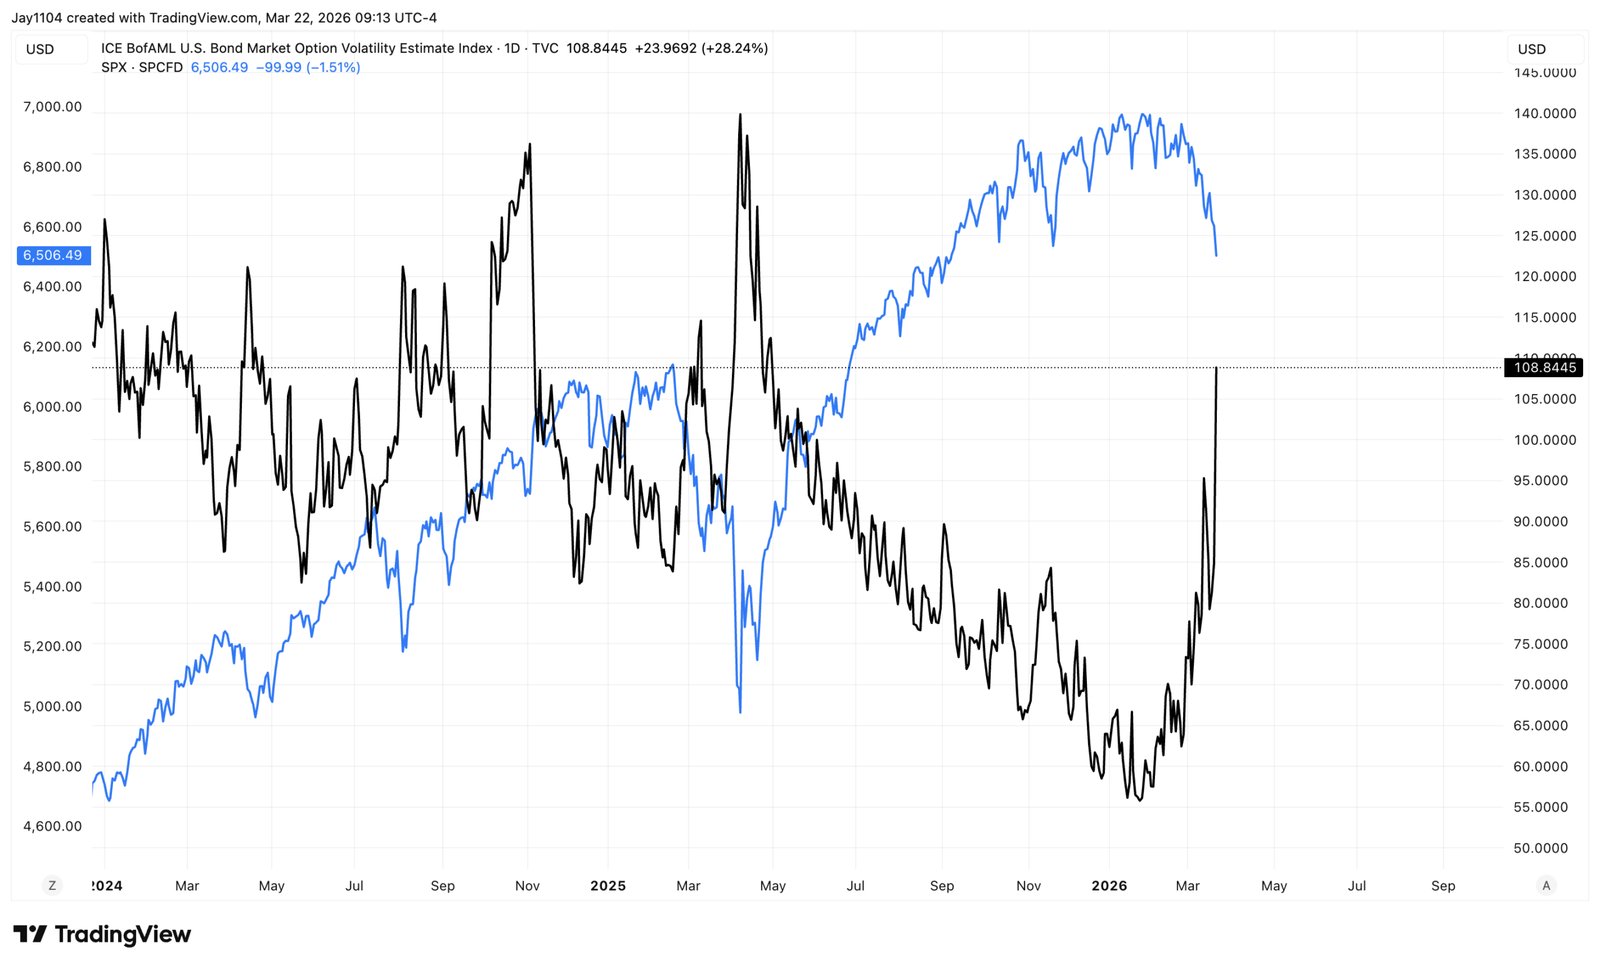
5. Fed Funds Futures — Rate Expectations Have Shifted Dramatically
One of the key drivers of the selloff: Fed funds futures have shifted from pricing rate CUTS to potential rate HIKES as the Iran war drives oil and inflation fears. But this is the CONTRARIAN setup — when rate expectations reach maximum hawkishness during a geopolitical crisis, the actual outcome almost always surprises to the dovish side. The Fed is trapped and will need to cut when the war resolves and growth slows.
6. Vanna Model — Volatility Buying Power Exhausted
The Vanna model shows that buying power from volatility effects has been exhausted. This is a technical indicator that measures the impact of implied volatility changes on delta hedging flows. When Vanna buying power is exhausted at high VIX levels, it means the mechanical selling pressure from options market makers is running out of steam. The next move is for VIX to decline and Vanna to flip from headwind to tailwind — generating mechanical buying pressure.
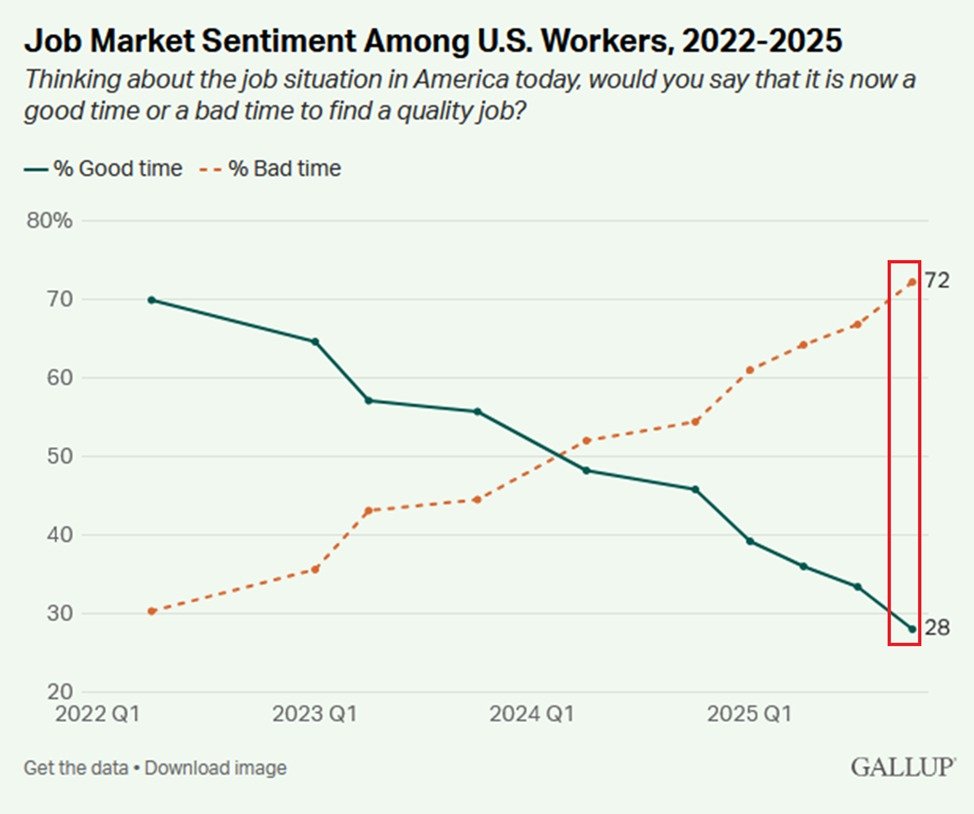
7. U.S. Labor Market Sentiment (03/29)
While consumer sentiment has collapsed to 53.3 (UMich, 03/28 final), actual labor market data remains solid. The disconnect between how people FEEL and what the data SHOWS is a classic fear-driven dislocation. When sentiment lags reality this dramatically, the sentiment typically snaps back — not the fundamentals.
8. ChartStorm Weekly — Deeply Oversold, Conditions for Rebound (03/29)
S&P 500 has broken key support, bears in control. Implied correlations and leveraged ETF trading point to a bounce. A deeply oversold equity market with Q1 earnings reports beginning to roll in creates conditions for a strong market rebound. The technicals are set up for a snapback. How quickly it materializes depends on the geopolitical catalyst.
9. Equity Valuations — Historical Mean Reversion Context
Valuation reversion chart shows where current multiples stand relative to historical patterns. The selloff has compressed valuations significantly — the S&P 500 forward PE has dropped from 22x to under 19x in weeks. During geopolitical crises that don’t trigger recessions, valuation compression of this magnitude has preceded 15-25% rallies within 12 months every single time since 2001.
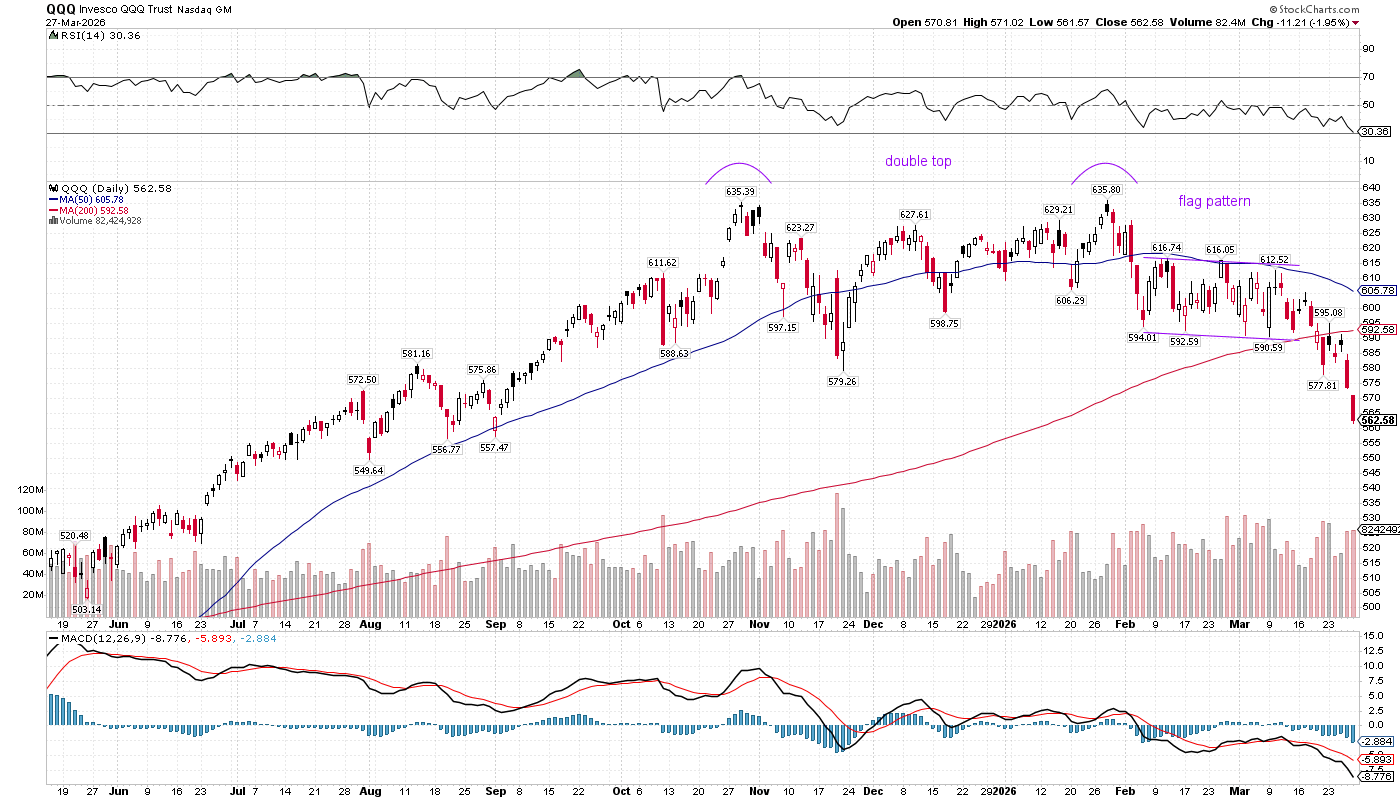
10. QQQ Technical Pattern — Oversold at Pattern Target (03/28)
QQQ is completing a double top and bear flag pattern. The key insight: the measured move target from this pattern has been MET. When technical patterns reach their measured targets at RSI oversold levels, it signals that the sellers have achieved their objective and the risk/reward flips to the upside.
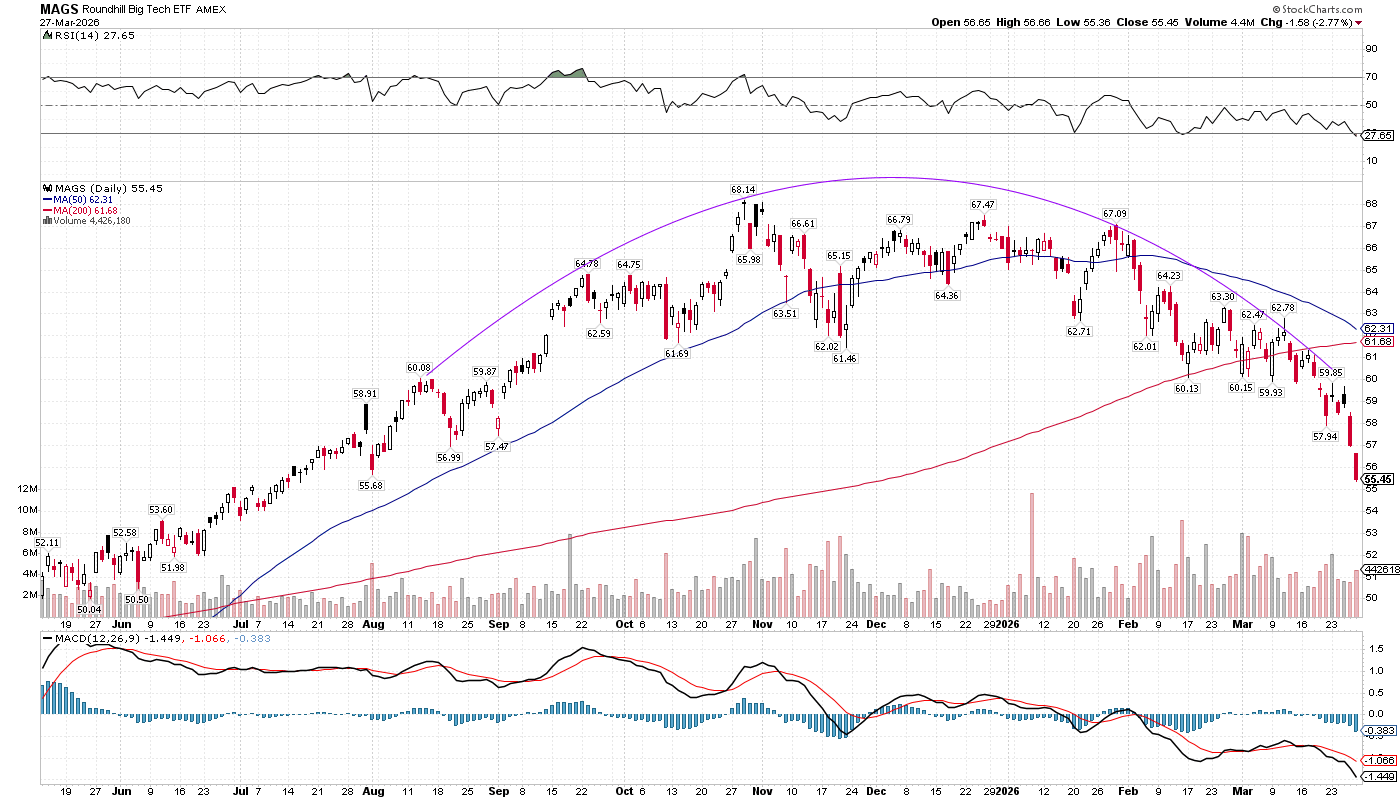
11. MAGS ETF (Magnificent 7) — Dome Pattern at Support (03/28)
The MAGS ETF, which tracks the Magnificent 7 stocks, shows a dome-shaped topping pattern. But the critical point: the ETF has reached the lower boundary of this pattern — key support. If this support holds, it confirms the base for a bounce. The Mag 7 have been the hardest hit group in this selloff, which means they have the most upside potential when sentiment reverses.
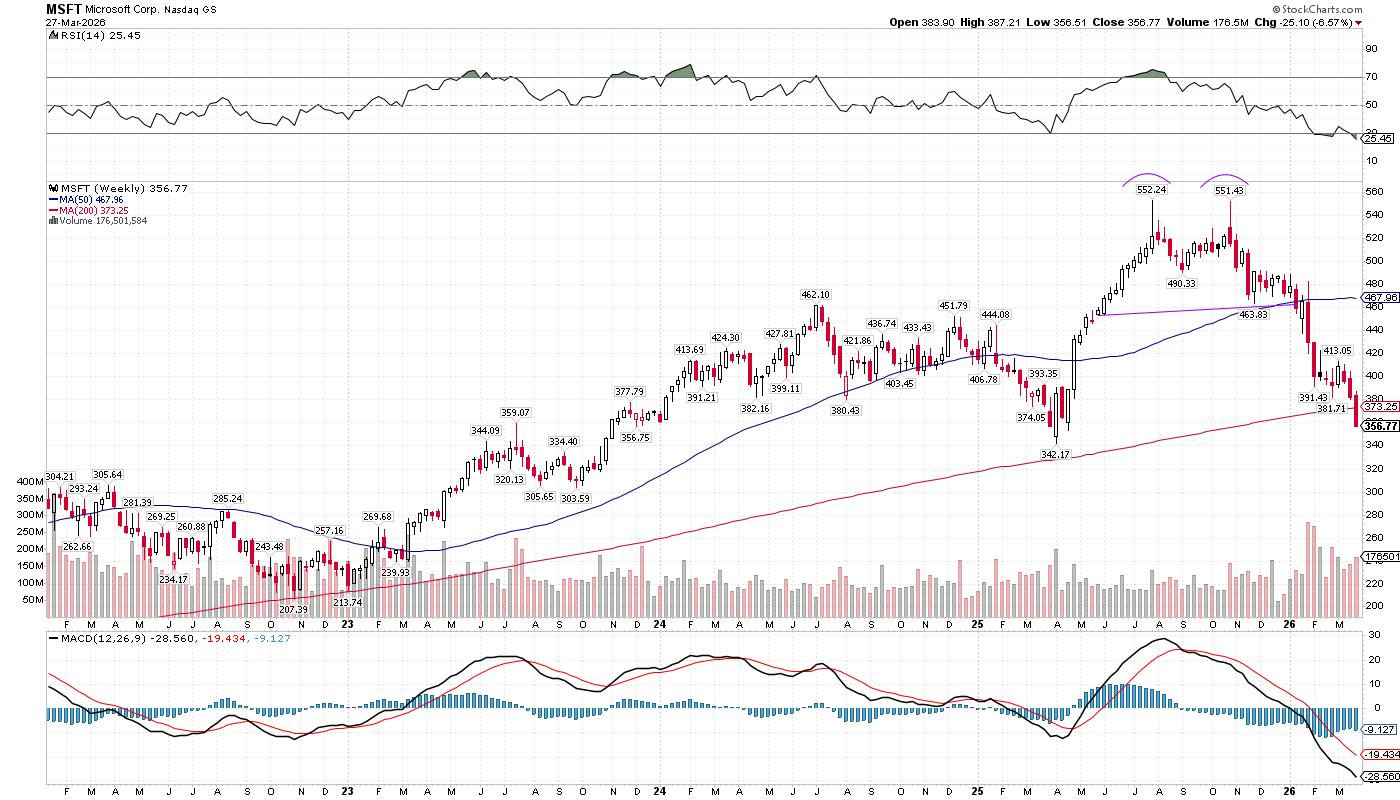
12. $MSFT — Double Top Reached Support, RSI 22 (03/28)
Microsoft completed a double top pattern and has reached its support breakdown level at $373. RSI at 22.05, Stochastic at 1.86 (virtually zero), Williams %R at -99.40 (max oversold). 53/53 analysts rate BUY. Avg PT $593 (59% upside). This is one of the most attractive near-term oversold candidate for a buying opportunity.”
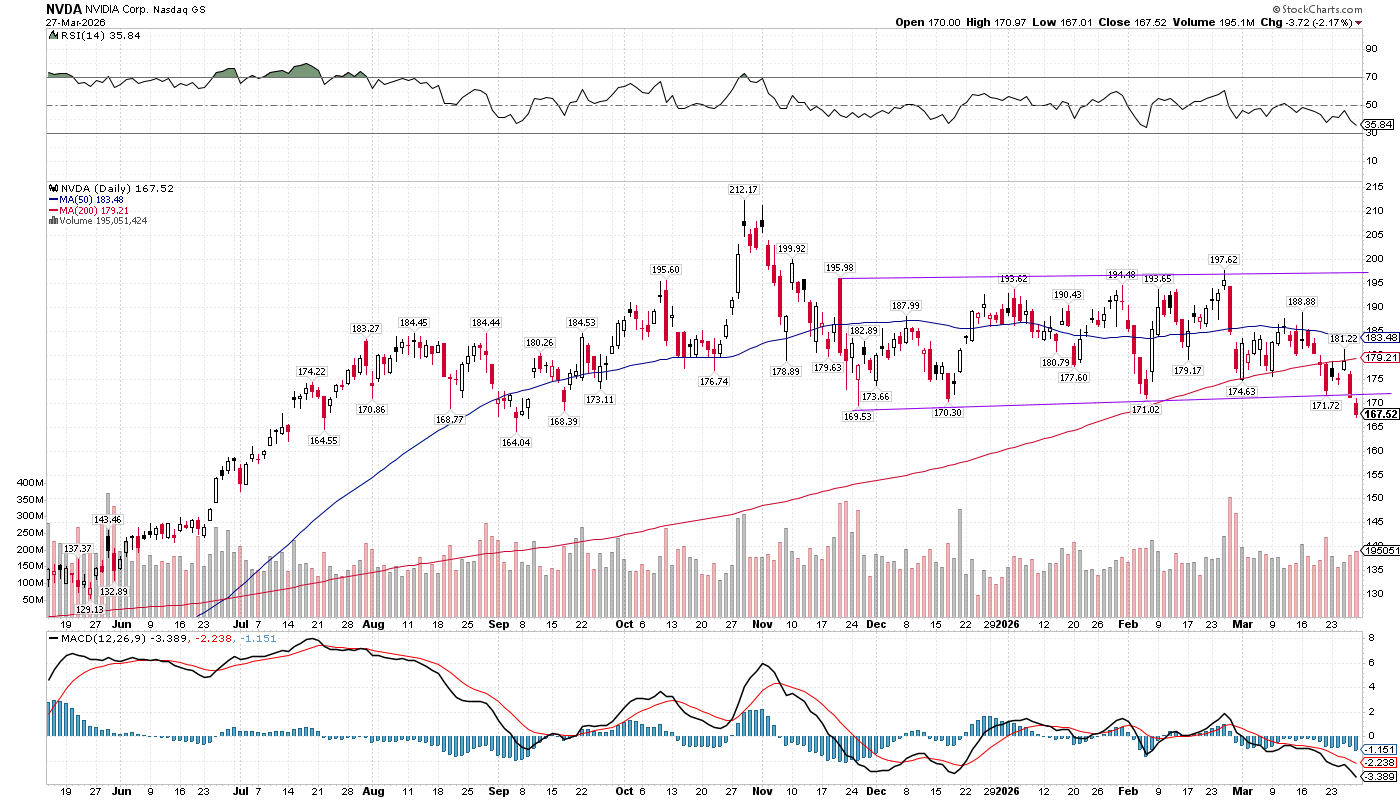
13. $NVDA — Rectangle Pattern Breakdown, Approaching Support (03/28)
NVDA broke down from a rectangle consolidation pattern and is approaching major support. The stock is deeply oversold on multiple timeframes. NVDA has been one of the hardest-hit Mag 7 names due to AI CapEx concerns + geopolitical risk. When the fear passes, NVDA’s fundamental story (AI infrastructure buildout) remains completely intact.
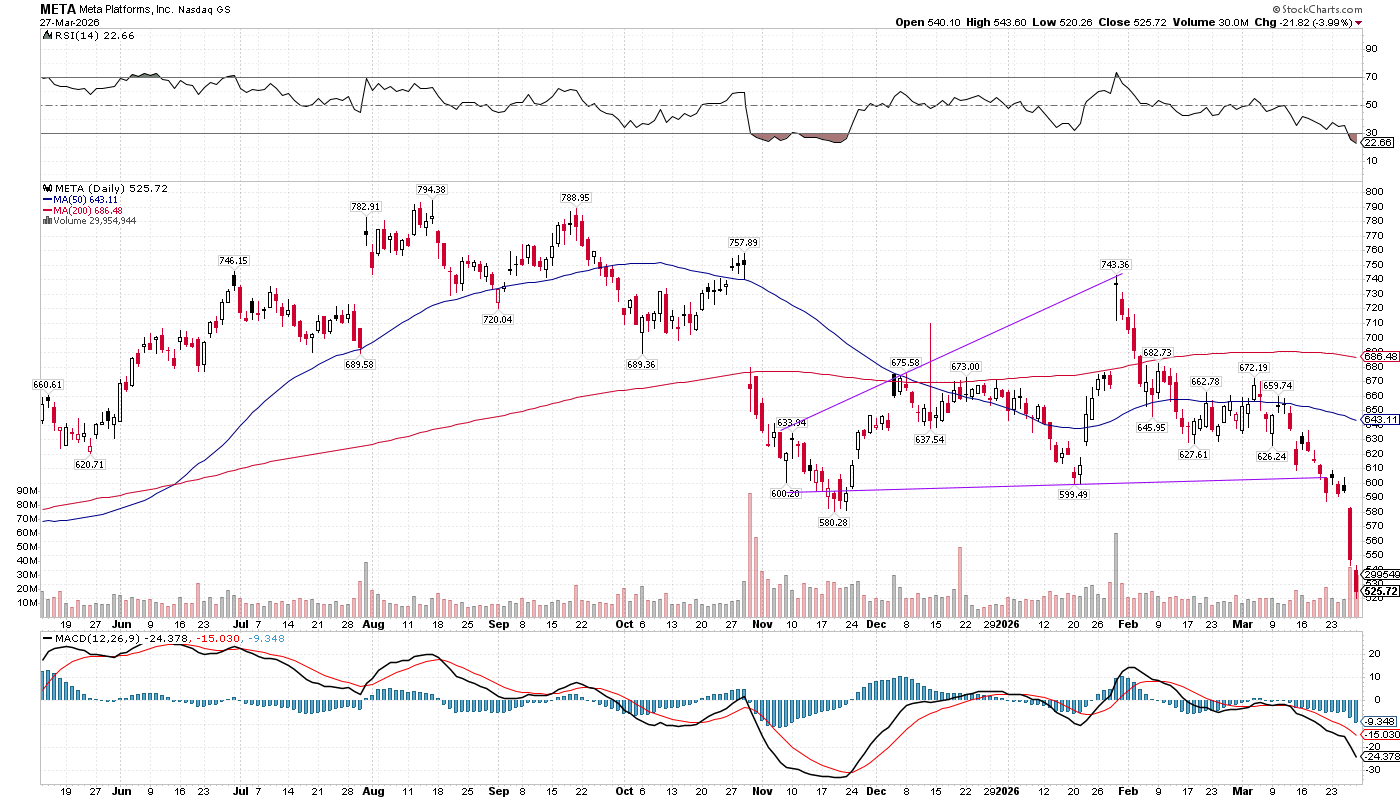
14. $META — Broadening Top at 19.7x Forward PE (03/28)
META shows a broadening top pattern with the stock at $560, down 18% from highs. At 19.7x forward earnings, this is the cheapest META has been in years — 18% below its 10-year median PE. Revenue grew 24% YoY to a TTM of $201B. The market is pricing Meta like a utility while it grows at 20%+ with 41% margins.
The Bottom Line
The charts from the past 3 days tell the whole story. S&P 500 below its lower Bollinger Band with RSI at 22. The Vanna model shows selling pressure exhausted. Goldman Sachs says we’re one tick from the buy zone. Valuations have compressed to levels that preceded 15-25% rallies. Tech is deeply oversold with earnings approaching. Every single Mag 7 stock has reached pattern support targets. This is the buying opportunity of 2026. The indicators highlighted are not lying.
Disclaimer: The information provided in this post is for educational and informational purposes only and does not constitute financial advice, investment advice, trading advice, or any other form of professional advice. The author is not a registered investment advisor, broker-dealer, or financial planner.
All investments and trading strategies involve risk, including the possible loss of principal. Past performance is not indicative of future results. You should conduct your own research and consult with a licensed financial professional before making any investment decisions.