Market Roadmap / Insights (05/05/2026)
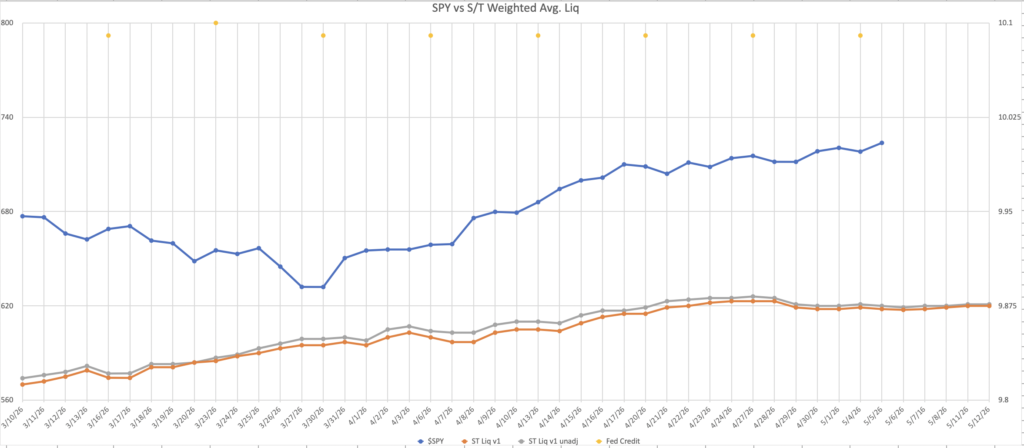
As of 05/05 NY Market close, liquidity continues to stay pretty flat into 05/12 (very slight upside). The market continues to rise higher and we remain very long.
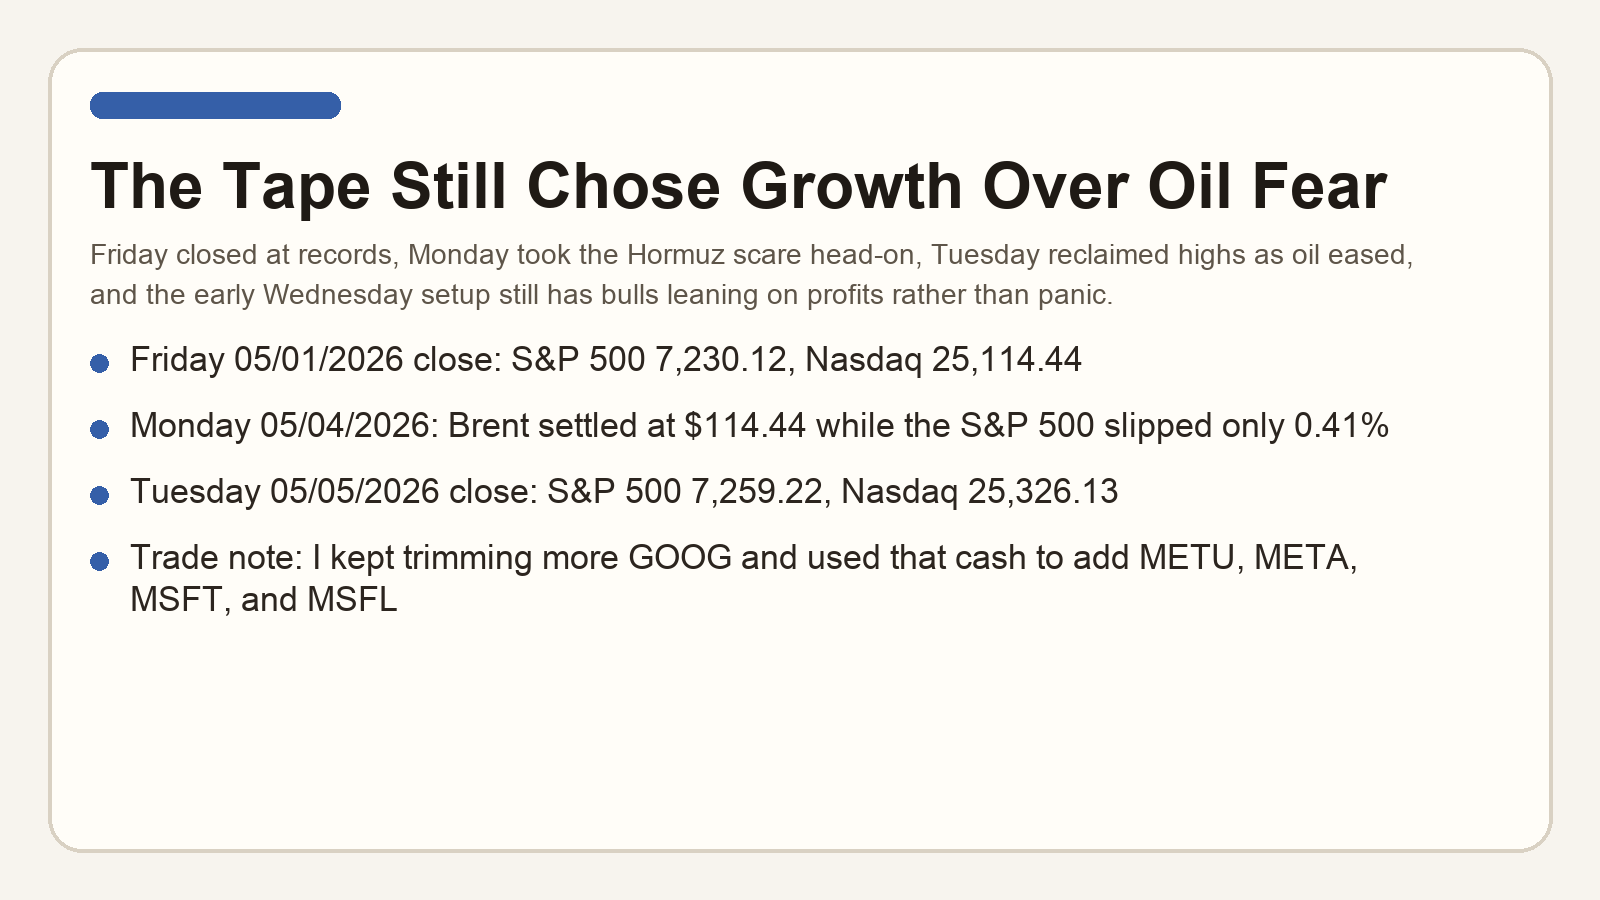
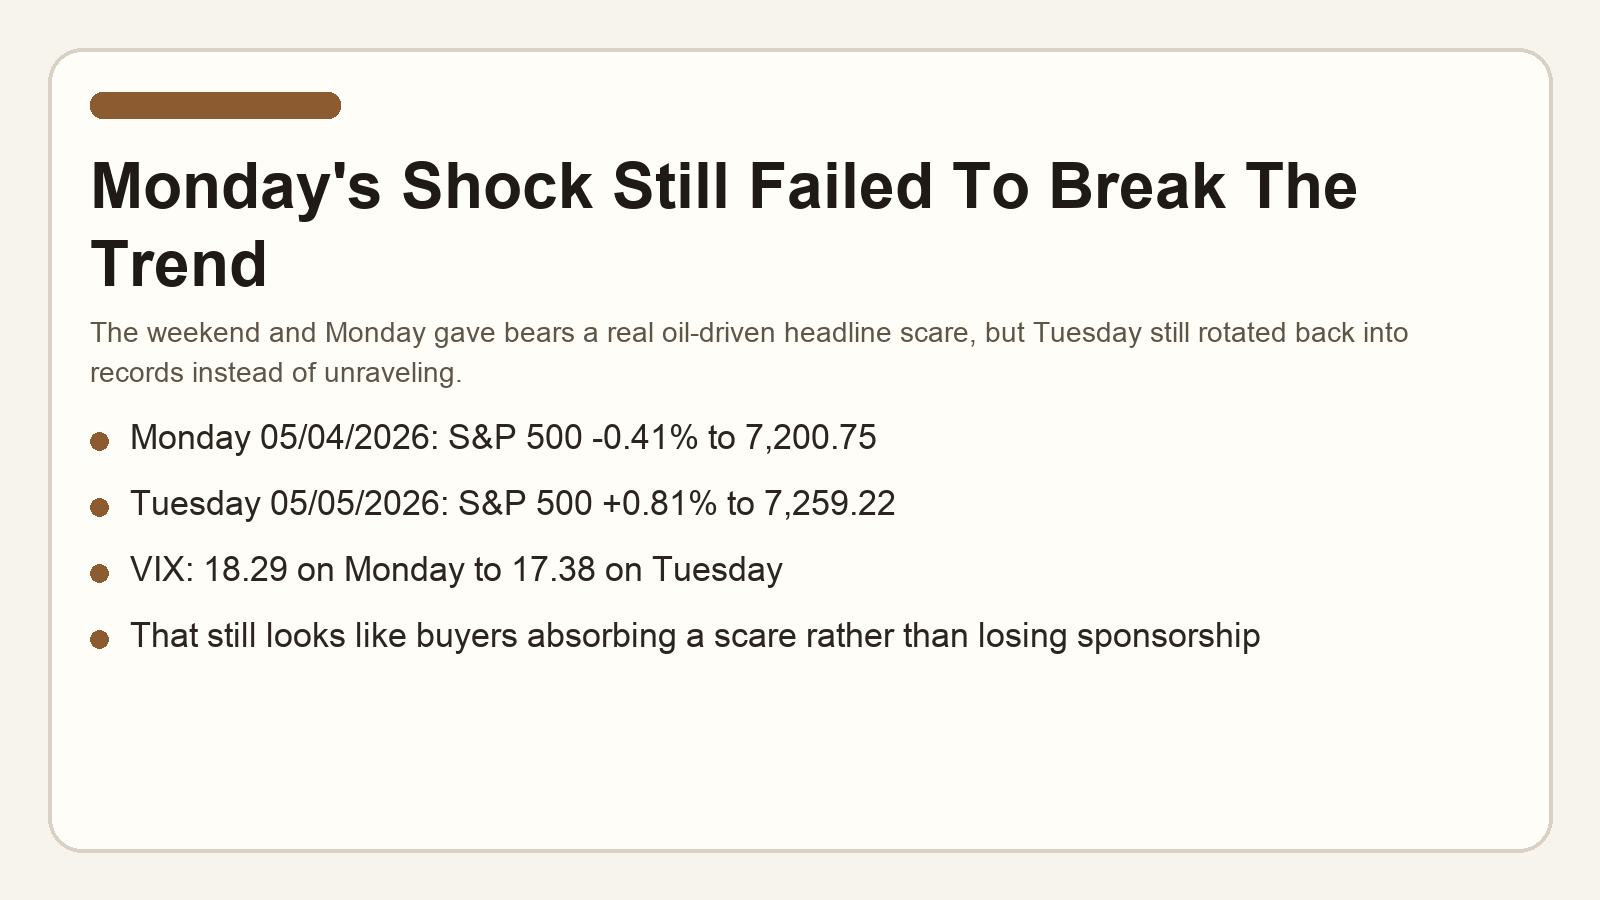
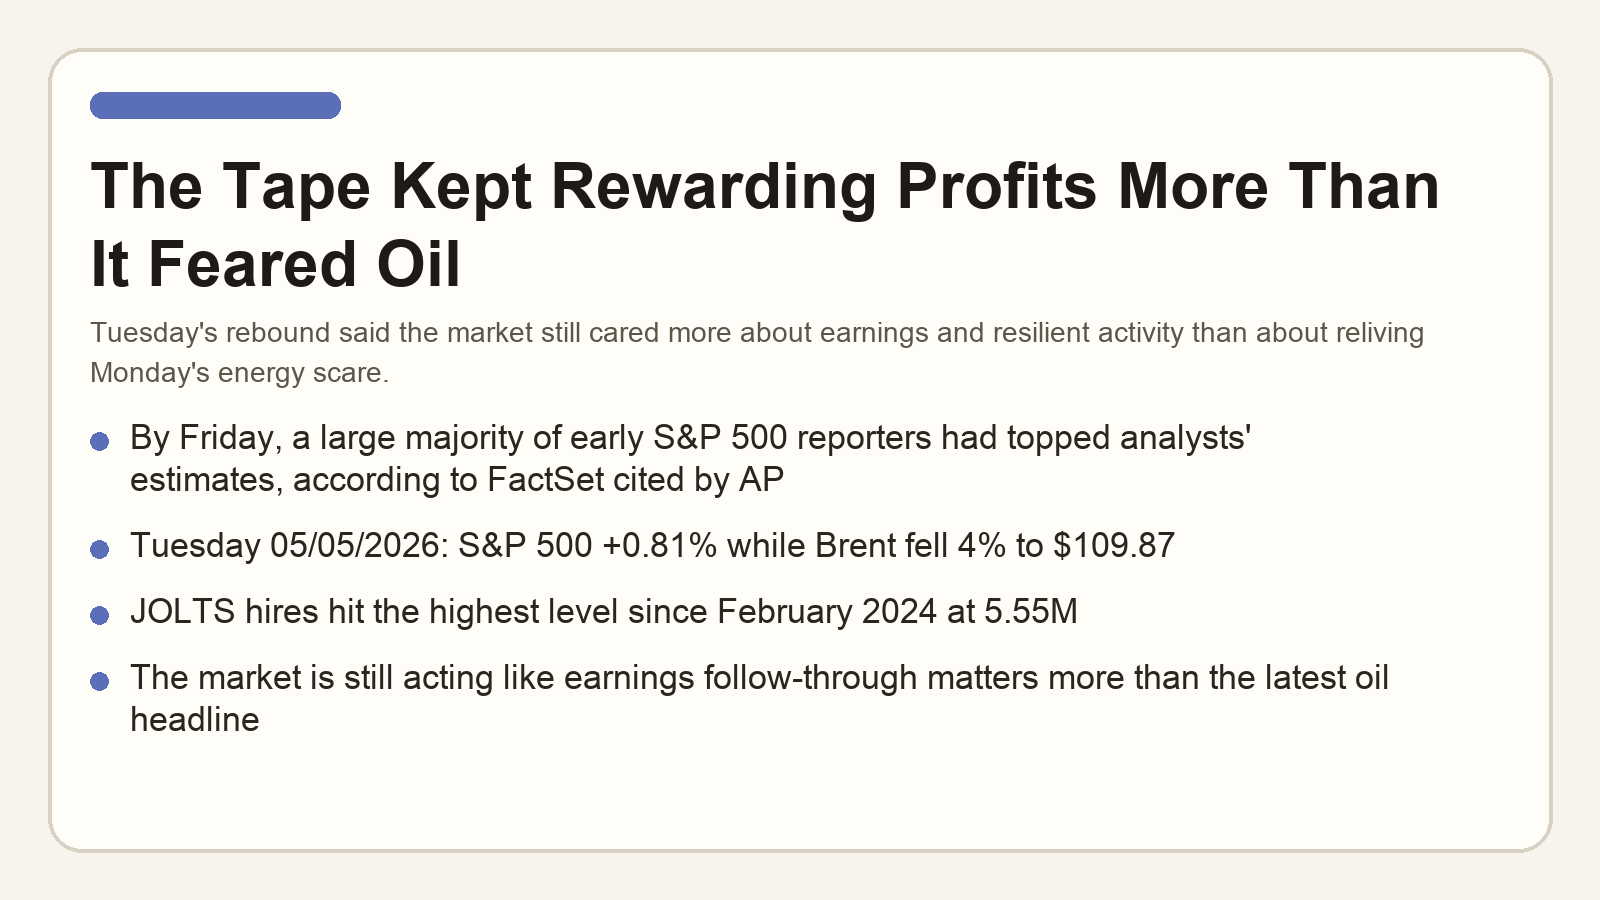
Since the last roadmap, the market has still not broken character. Friday 05/01/2026 closed at fresh highs as earnings kept beating and oil eased back, Monday 05/04/2026 then gave bears a real Hormuz flare-up and a 5.8% Brent spike to work with, and Tuesday 05/05/2026 still turned right back around into another record close once oil backed off and profits re-took center stage. I continued trimming more GOOG as Google ripped to new highs and used that cash to buy more METU, META, MSFT, and MSFL. I remain very long overall and I am still willing to re-add more leverage on a deeper dip.
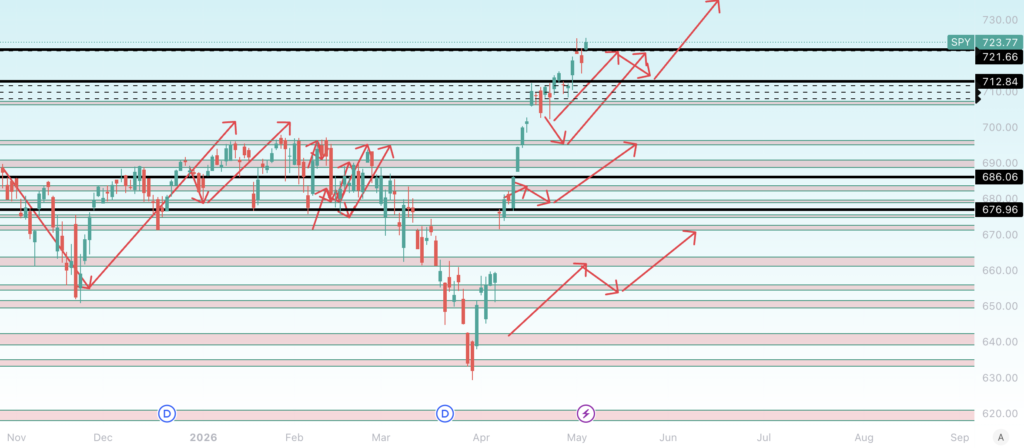
At the Tuesday, May 5, 2026 close, SPY finished at $723.77 versus Monday’s $718.01 close, up +0.80%. That is still not what a market on the verge of failure looks like after absorbing a weekend oil scare, a Monday drawdown, and one more round of macro noise. I wouldn’t be surprised at a near term retest of $712-713 but it isn’t something I’m anticipating. We can go straight to $740 from here.
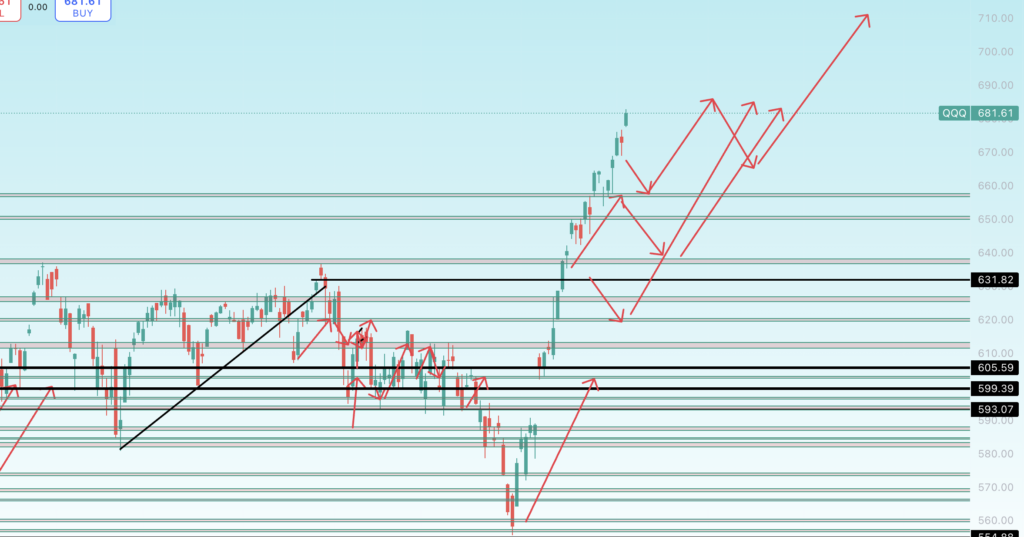
Tech leadership still did the heavy lifting. At the Tuesday, May 5, 2026 close, QQQ finished at $681.61 versus Monday’s $672.88 close, up +1.30%, while XLK closed at $165.63 versus $162.05, up +2.21%. That is still the right part of the tape asserting control. And we remain heavy long on tech. My “crazy” $680 $QQQ target has been hit. I am expecting $710 on the next leg up.
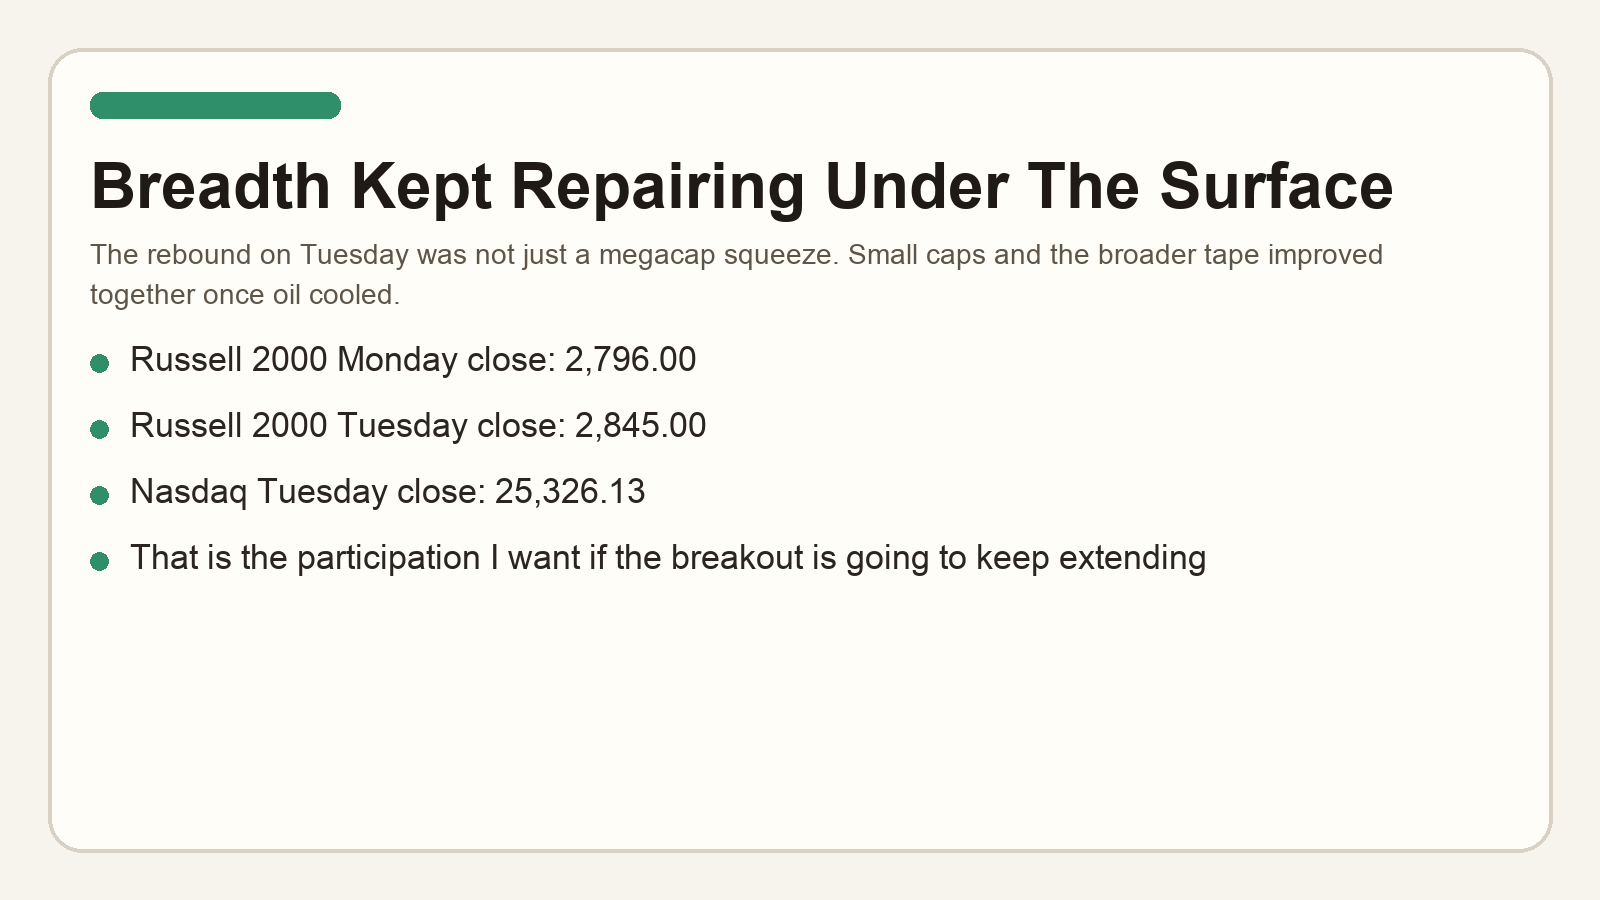
The internal tone still looks constructive to me. Monday 05/04/2026 was the session that should have done real damage if bulls were wrong: oil spiked, the Strait headlines got worse, and traders had every excuse to dump risk. Instead, Tuesday 05/05/2026 turned right back into a broad rebound. When that keeps happening, you listen.
We saw April finish positive. Statistically this has led to a significantly higher market by EOY EVERY SINGLE TIME in history.
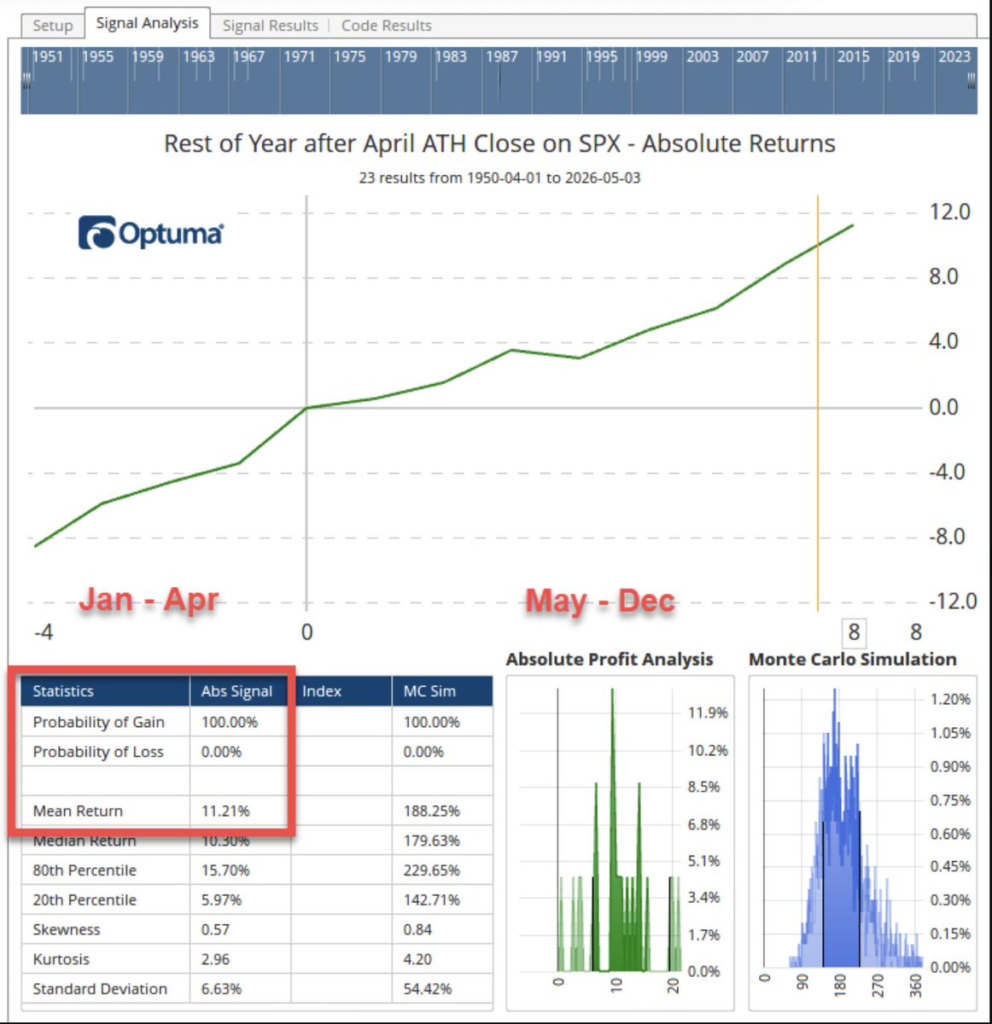
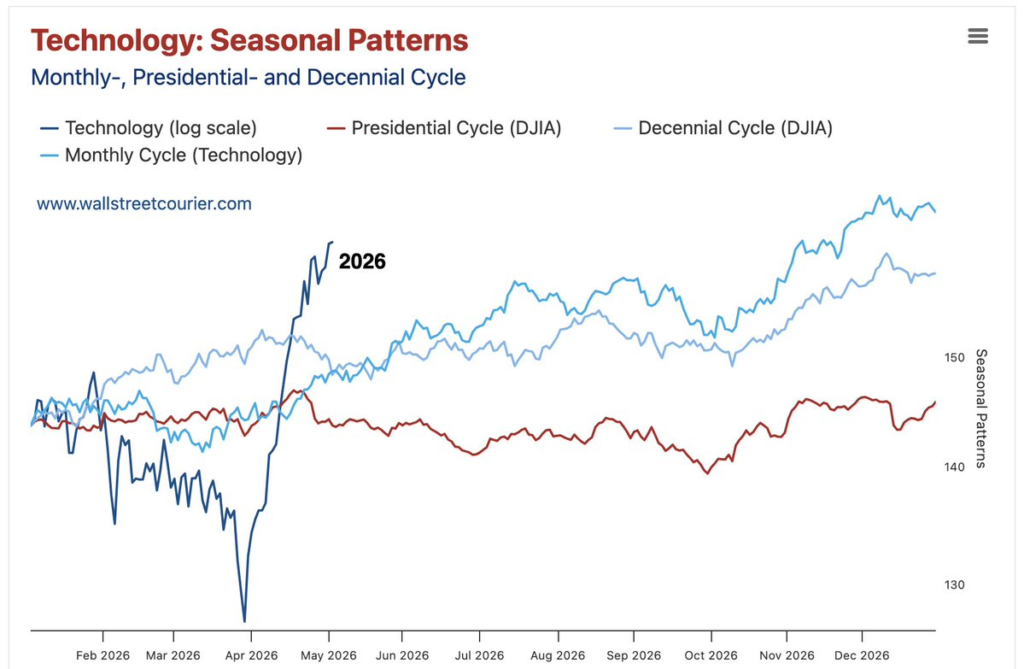
The seasonality work still says a strong start to the year and a solid tape going into May usually matter more than the old cliché about a weak summer. When momentum, breadth, and earnings are still cooperating, I would rather respect that than fight a calendar slogan.
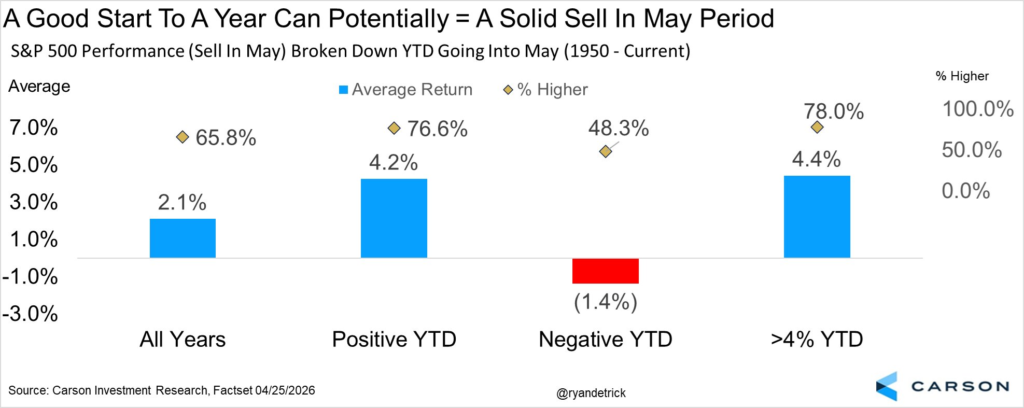
Seasonality, breadth, and the internals all improved
Tech has gone from extremely underperforming to outperforming in the blink of an eye. And I was screaming to stay fully in tech when we were at the lows. There is higher to go still.
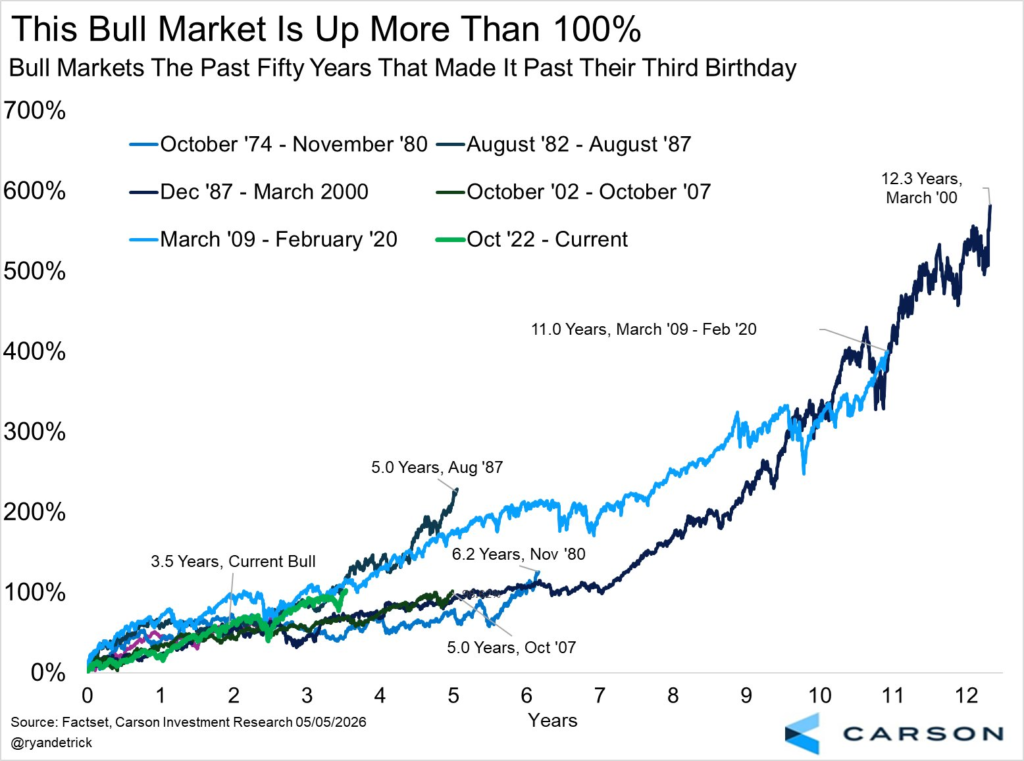
This bull market is still very young when compared to history. If history rhymes, we have many years to go still.
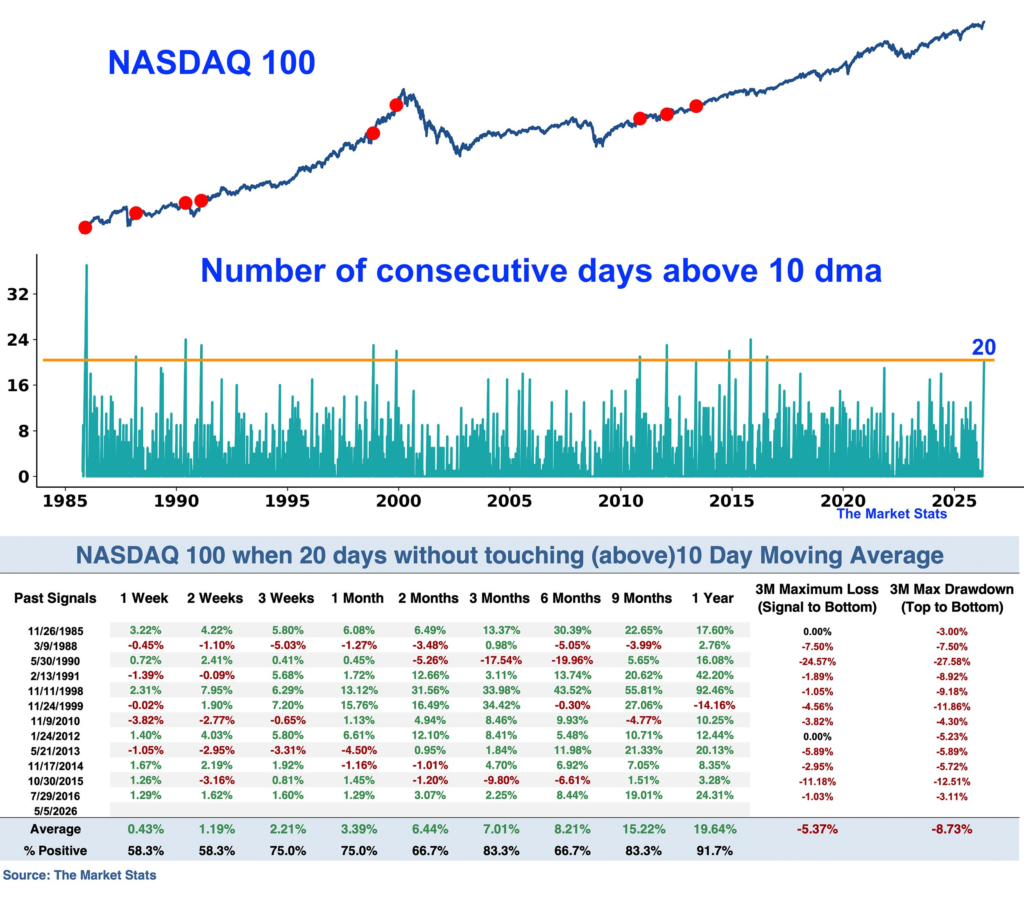
$NQ has remained above its 10DMA for 20 days. In the past when this happened, we saw $NQ higher 80+% of the time 3 months+ out.
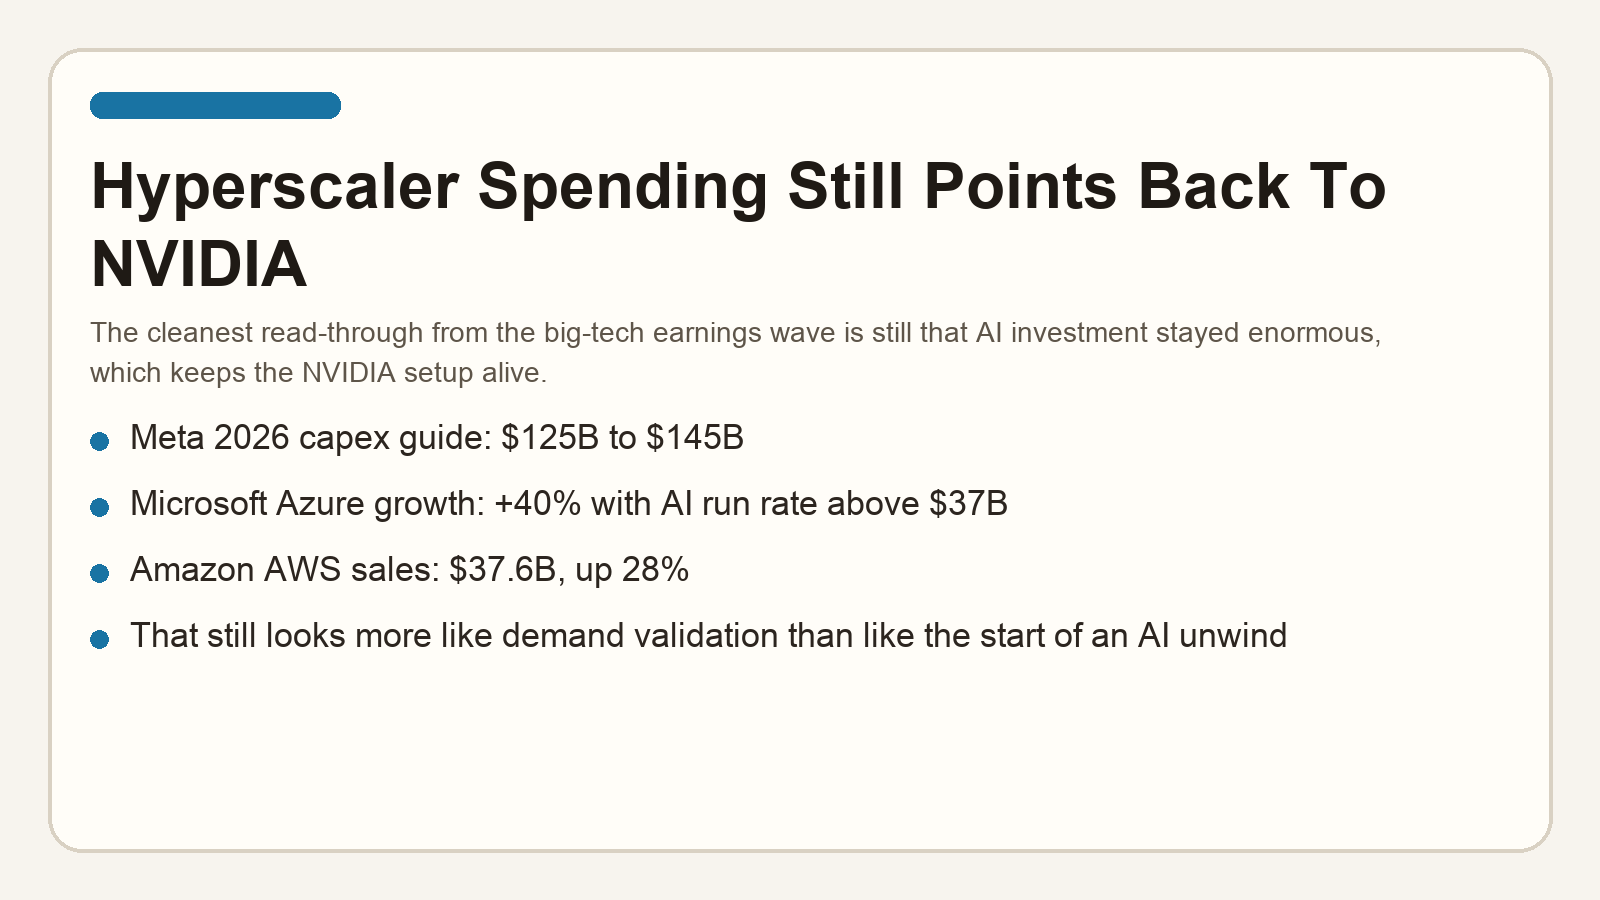
The AI-spend picture still matters because it keeps telling us that the biggest tech platforms are not pulling back. They are still building. If hyperscaler capex is still getting revised higher and the market is still willing to fund that story, the upside case in AI leadership is not dead.
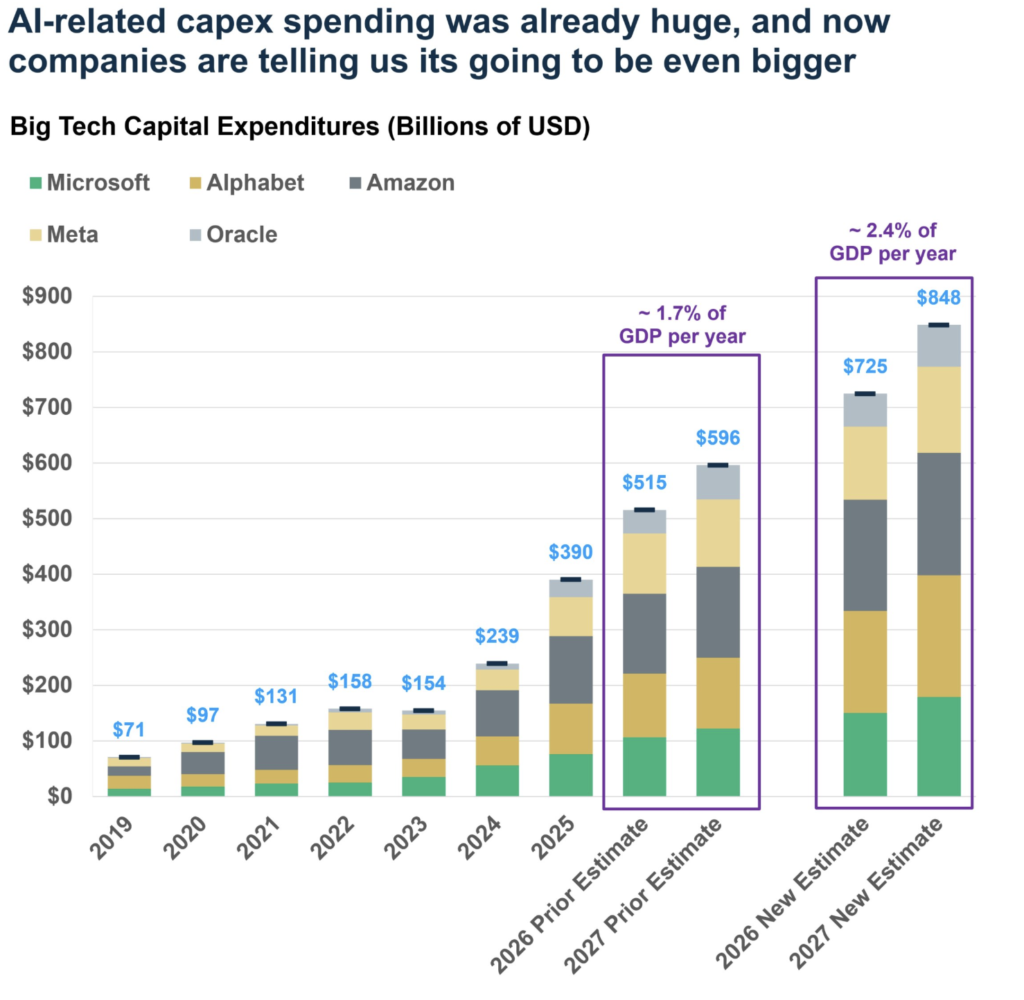
Forward earnings are still one of the cleaner bull arguments on the board. If the market were genuinely rolling into a deeper problem, I would expect forward S&P 500 EPS and the quality of the earnings tape to be deteriorating together. Instead, what we keep seeing is a market forcing the biggest spenders to justify the capex while the broader profit backdrop stays solid.
Tuesday 05/05/2026 macro still leaned more resilient than broken. The March trade deficit widened to $60.3 billion from $57.8 billion in February as exports rose to $320.9 billion and imports reached $381.2 billion. JOLTS then showed job openings at 6.87 million versus 6.92 million in February, while hires jumped to 5.55 million, the highest level since February 2024. ISM Services stayed in expansion at 53.6, with business activity at 55.9 and prices still hot at 70.7.
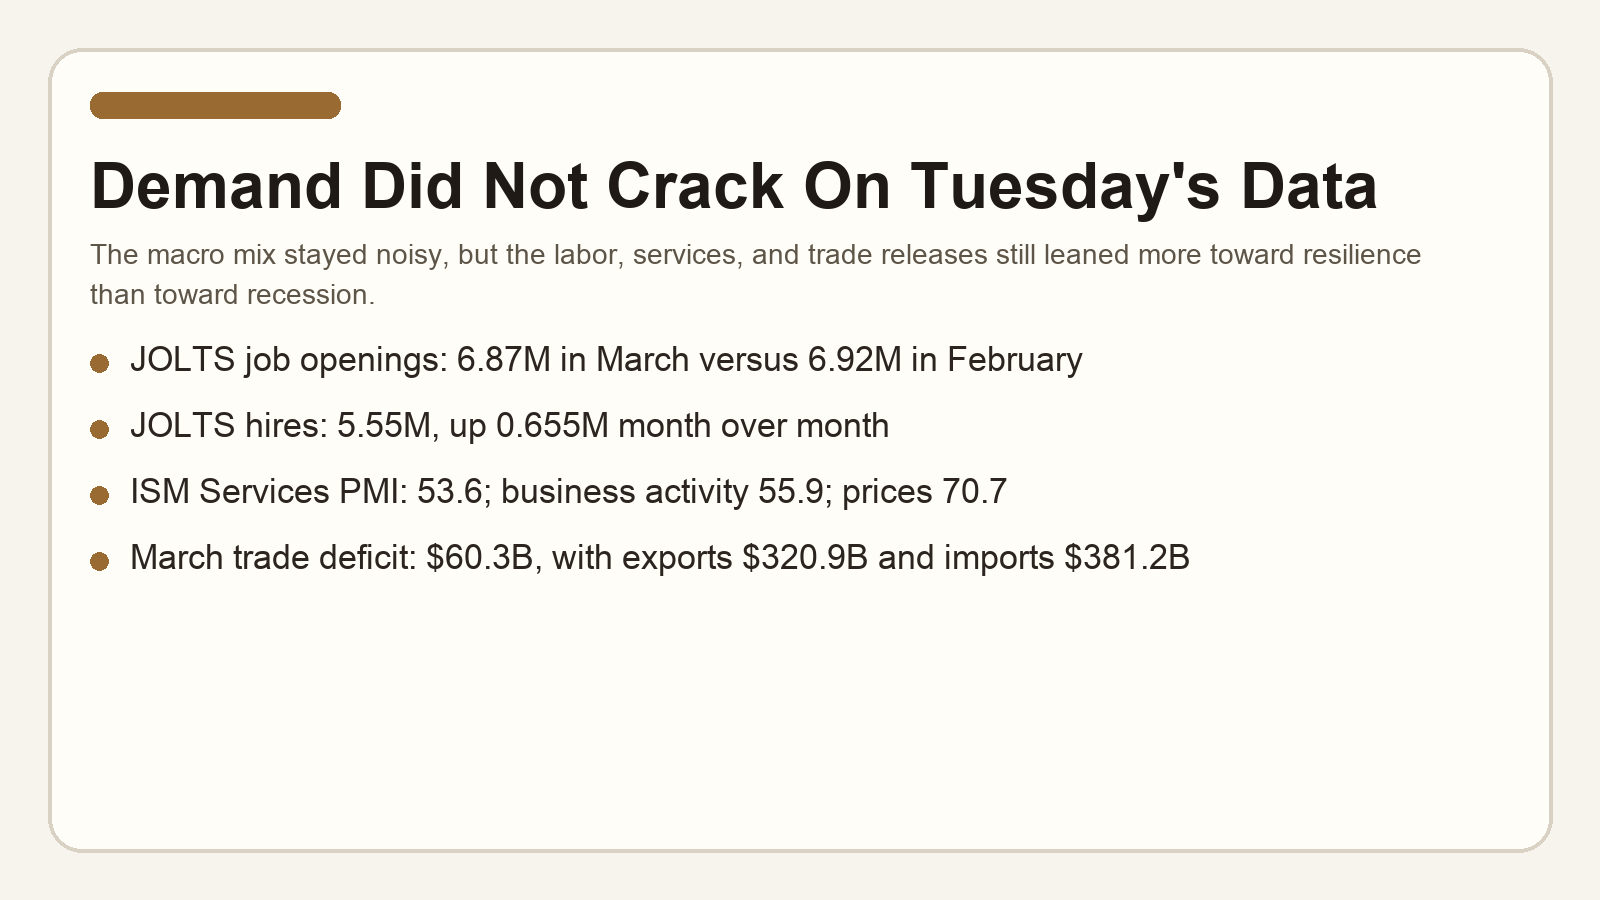
The tape-support read-through was still bullish even if the data were not perfectly clean. ISM new orders cooled to 53.5 from 60.6, and services employment stayed soft at 48.0, but the market still chose to focus on rising hires, still-expanding services activity, and the fact that oil gave back much of Monday’s spike. That is what it means when the market chooses profits and demand over fear again.
The consumer remains STRONG. Retail sales blast higher as consumers continue to spend. This economy is doing well.
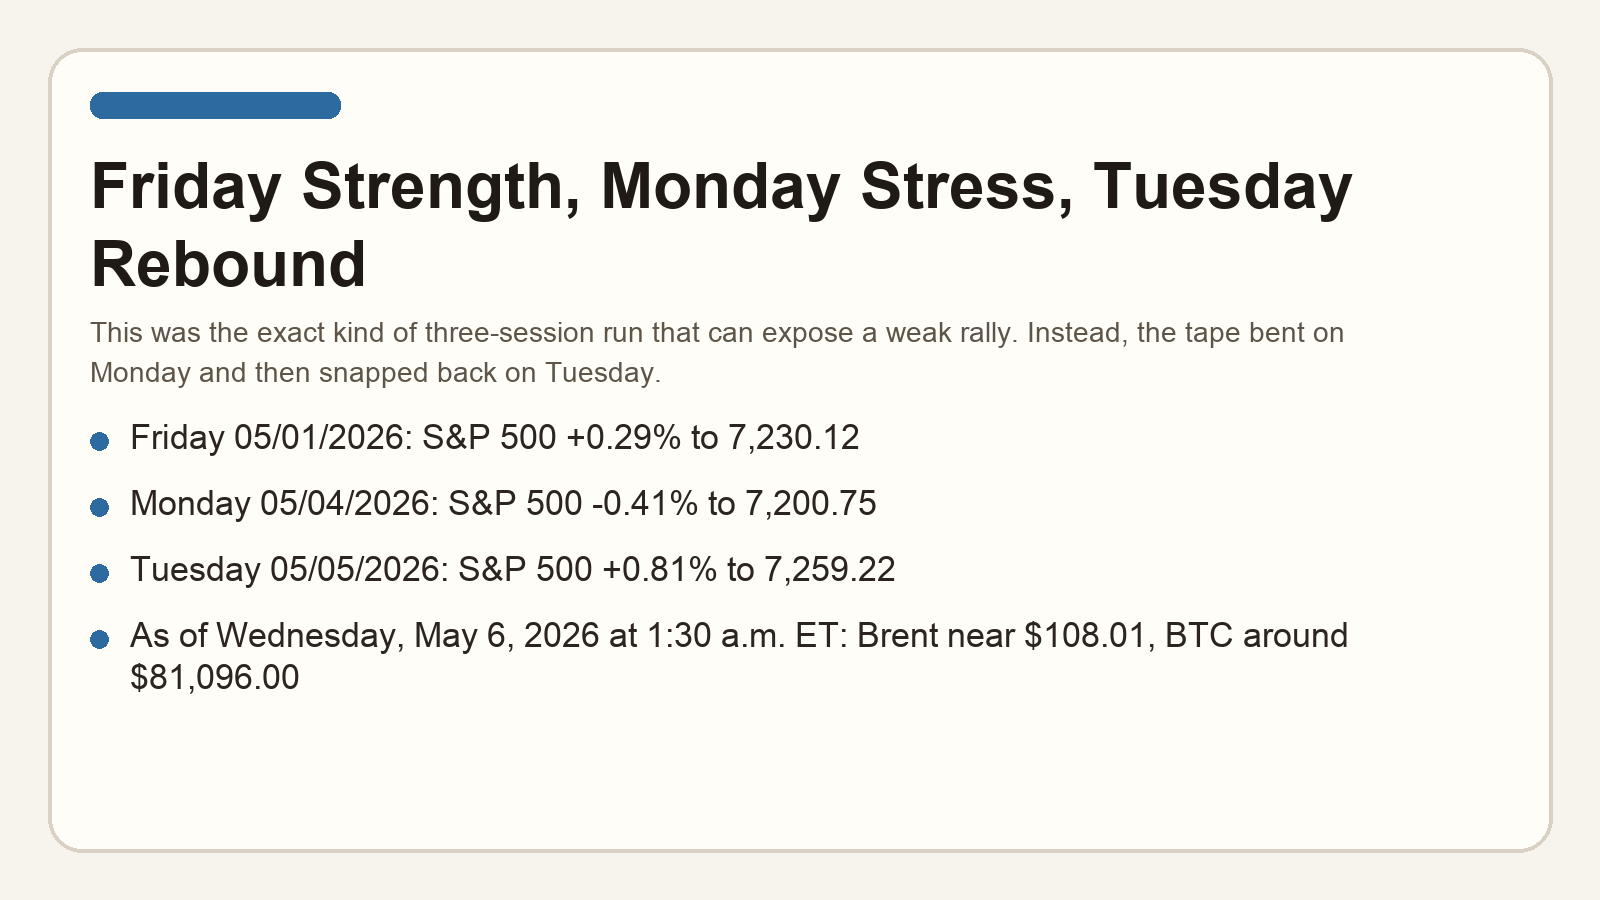
Market recap: Friday 05/01 through Tuesday 05/05, plus the Wednesday 05/06 overnight setup
Friday 05/01/2026: S&P 500 +0.29% to 7,230.12. Dow -0.31% to 49,499.27. Nasdaq +0.89% to 25,114.44. Apple helped lead the tape to more records as earnings kept coming in better than expected and oil prices pulled back.
Monday 05/04/2026: S&P 500 -0.41% to 7,200.75. Dow -1.13% to 48,941.90. Nasdaq -0.19% to 25,067.80. The market finally had to deal with a real energy scare again as the Hormuz reopening effort and attacks in the UAE drove Brent up 5.8% to $114.44.
Tuesday 05/05/2026: S&P 500 +0.81% to 7,259.22. Dow +0.73% to 49,298.25. Nasdaq +1.03% to 25,326.13. Oil then gave back much of Monday’s jump, Brent fell 4% to $109.87, and Wall Street snapped right back to records as companies kept topping expectations.
As of Wednesday, May 6, 2026 at 1:30 a.m. ET: the setup still looked more constructive than fearful. Brent was around $108.01, WTI was around $100.62, and BTC was still around $81,096.00. That is not a disaster tape. That is a market waiting to see whether the calm can extend into the next cash session.
That whole sequence is why I am still leaning bullish. Friday showed the market could extend. Monday showed the market could absorb a geopolitical shock. Tuesday showed it could re-accelerate once oil cooled. The overnight setup into Wednesday still looked like follow-through was on the table if energy stops dictating every headline.
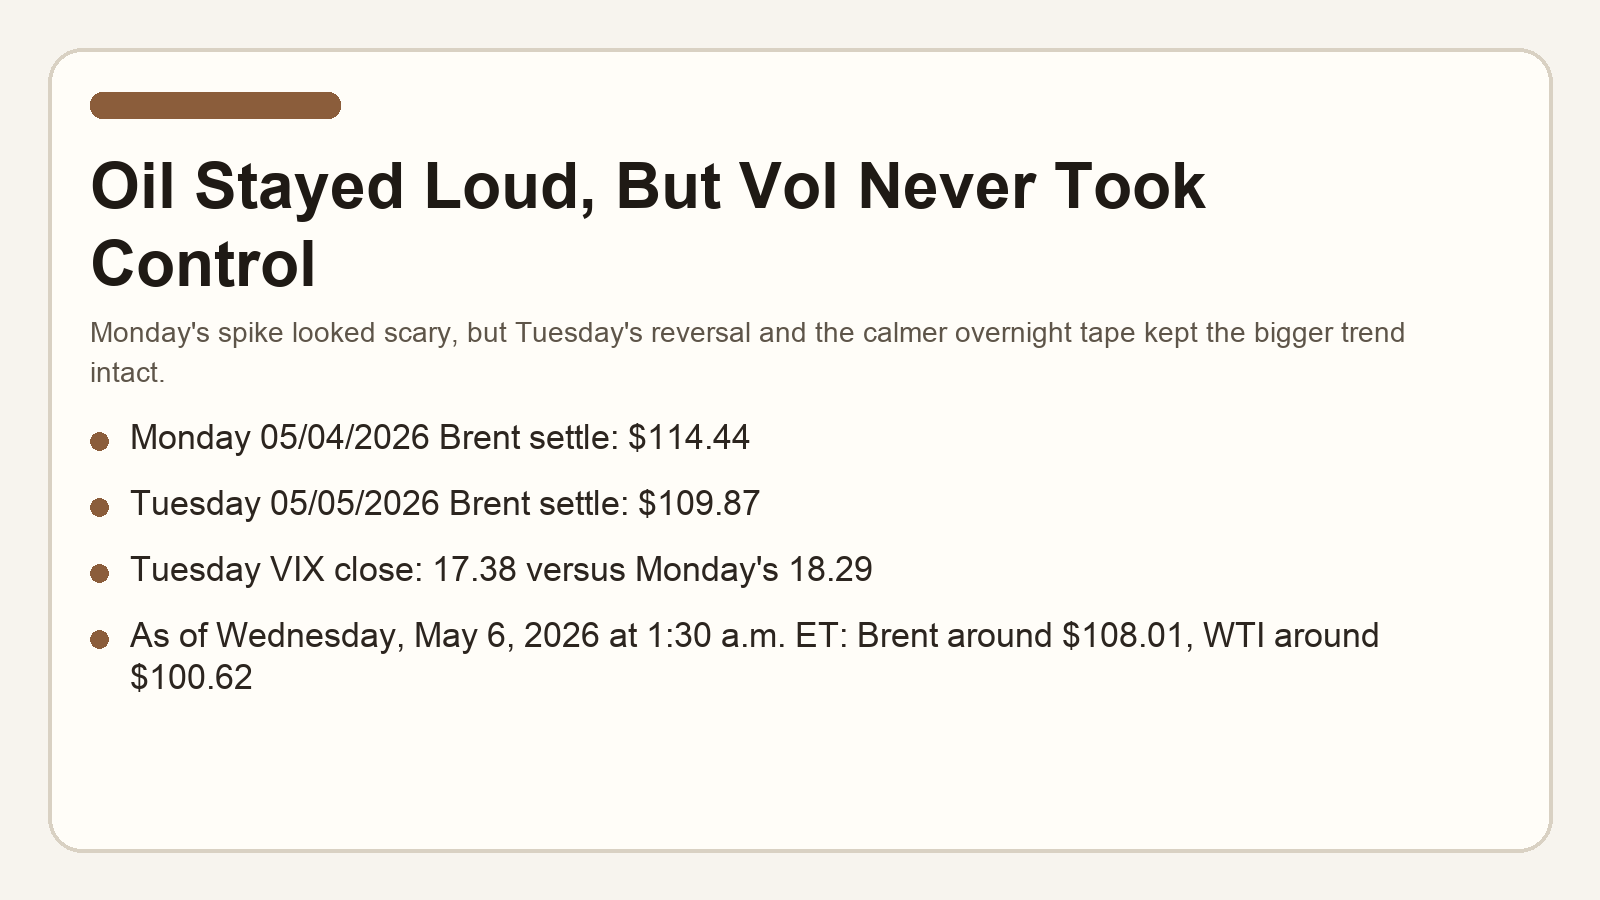
Oil and volatility are still important, but not in control
Oil still matters, but it is not running the whole show anymore. Friday 05/01/2026 saw easing crude help stabilize the tape, Monday 05/04/2026 then sent Brent up to $114.44 as the Hormuz and UAE flare-up hit, and Tuesday 05/05/2026 brought Brent back down to $109.87 while VIX eased to 17.38 from Monday’s 18.29. Then As of Wednesday, May 6, 2026 at 1:30 a.m. ET, Brent was around $108.01. That still looks like a market that can absorb oil risk rather than one trapped by it.
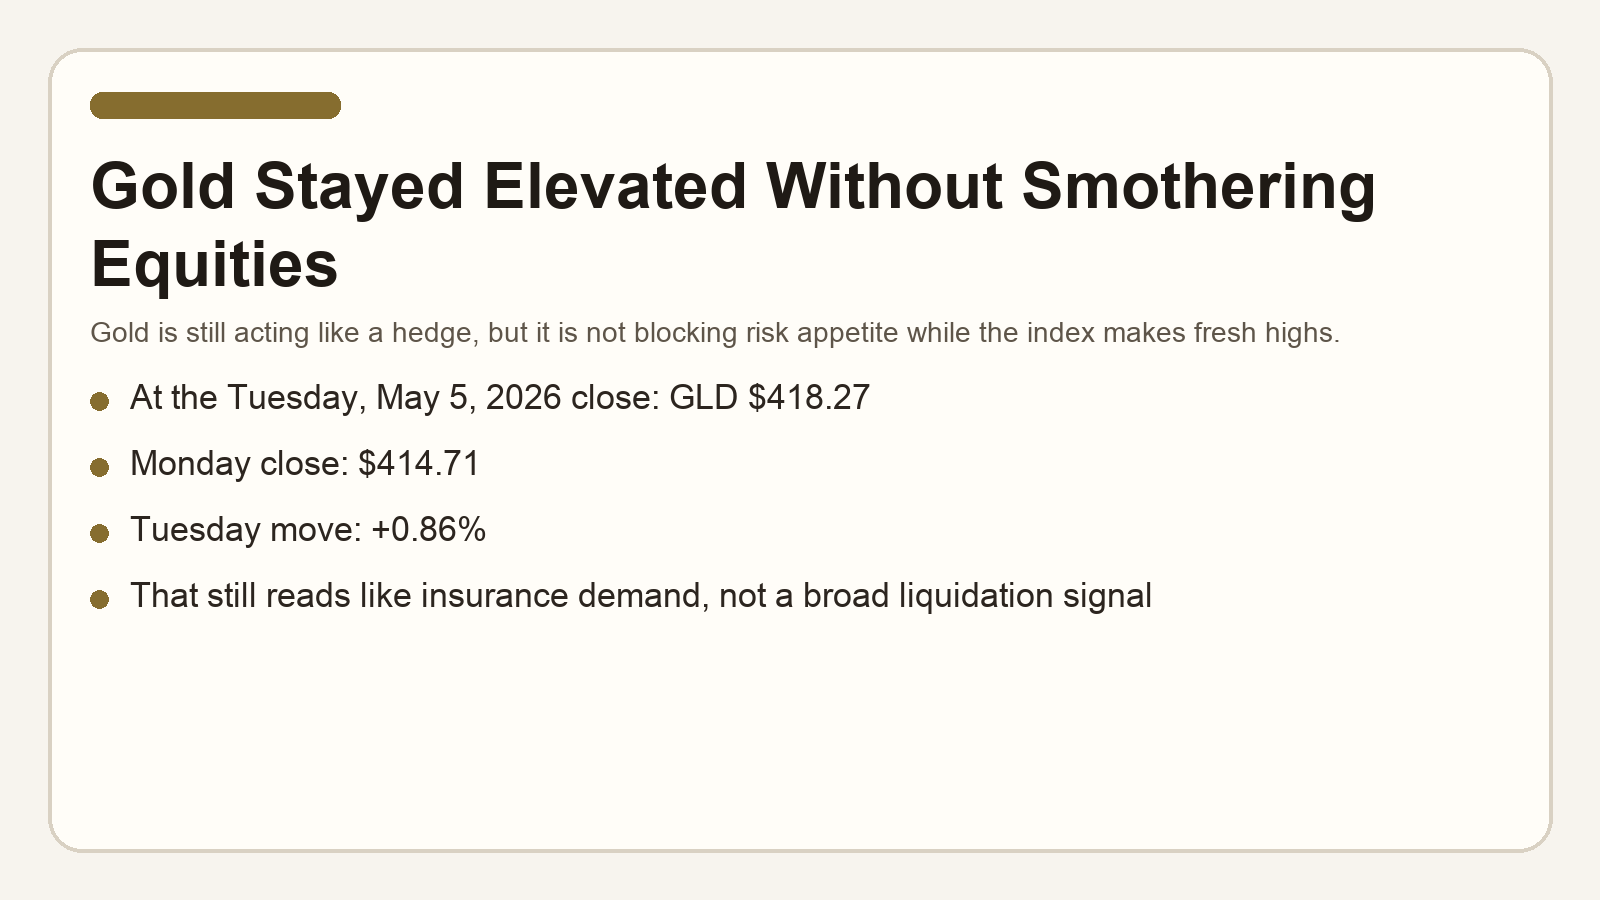
Gold is elevated, but not blocking risk appetite
Gold is still elevated, but it is not stopping risk-on behavior. At the Tuesday, May 5, 2026 close, GLD finished at $418.27 versus Monday’s $414.71 close, up +0.86%. I still like the hedge case in gold, but it is coexisting with a higher S&P 500 just fine.
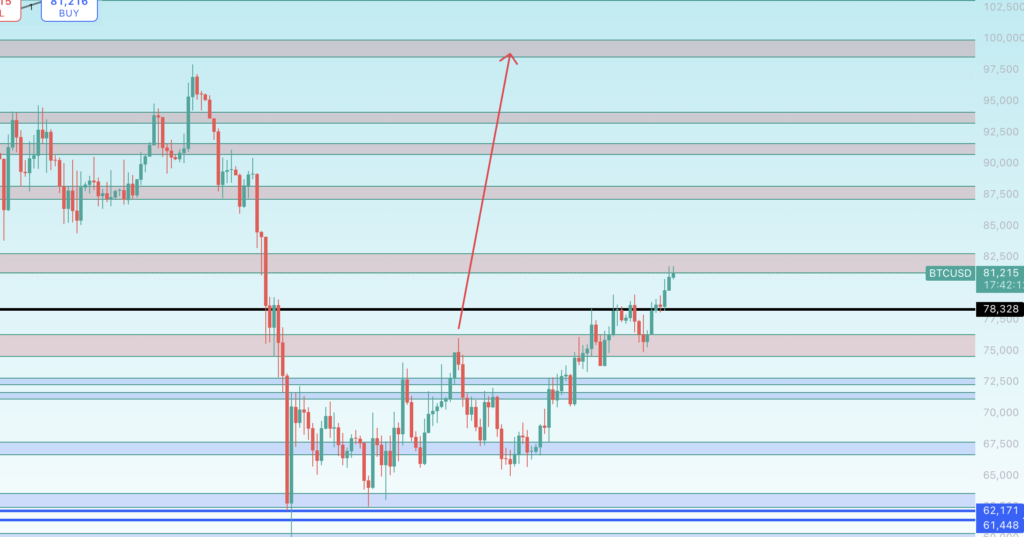
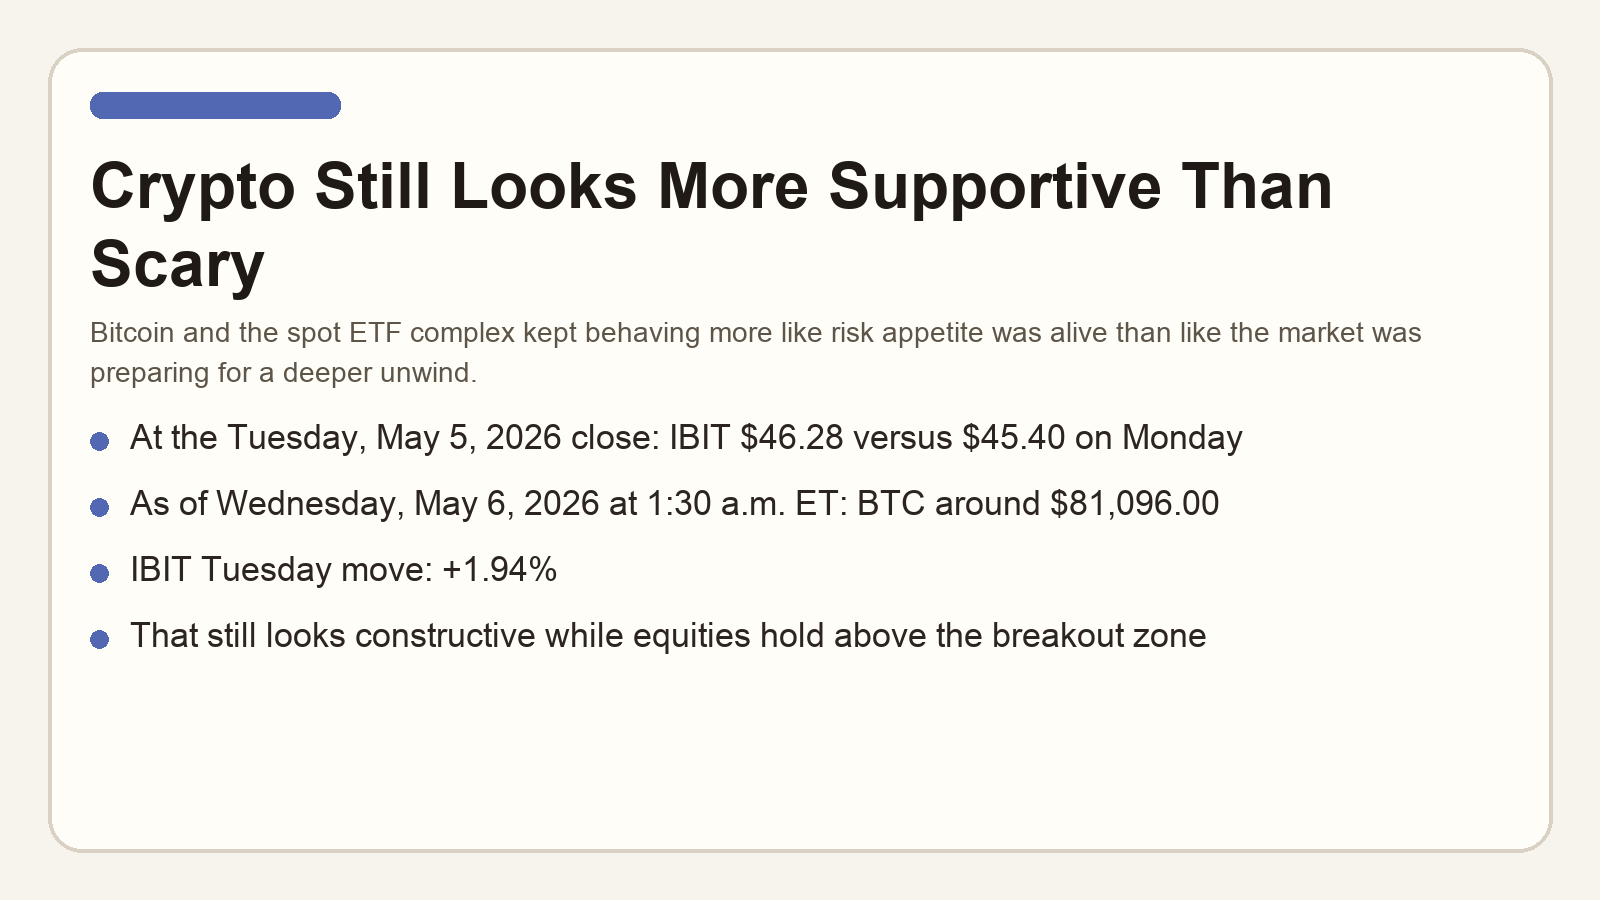
Crypto remains constructive
Crypto also still reads more constructive than threatening. At the Tuesday, May 5, 2026 close, IBIT closed at $46.28 versus $45.40 on Monday, up +1.94%. Bitcoin has rallied to $81K now. I remain long crypto and confident it will be going much higher. I will take trims around $100K.
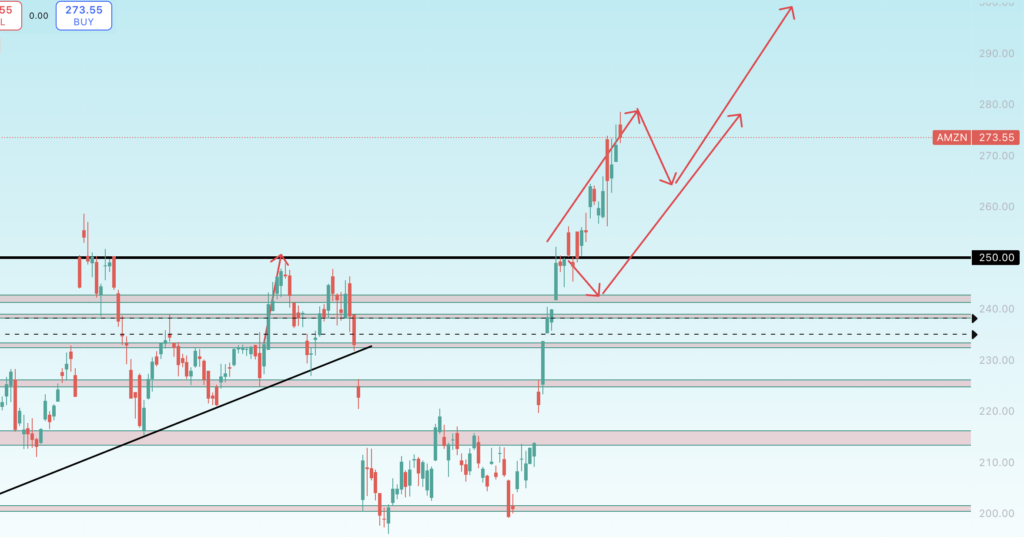
Amazon
Amazon still looks like one of the cleaner leadership names in the tape. At the Tuesday, May 5, 2026 close, AMZN finished at $273.55 versus Monday’s $272.05 close, up +0.55%. That is still exactly the kind of post-report behavior I want if institutions are rewarding quality growth.
I also still lean bullish on the business follow-through, not just the chart. Amazon reported Q1 net sales of $181.5 billion, up 17%, AWS sales of $37.6 billion, up 28%, and operating income of $23.9 billion. The Q2 guide for net sales of $194.0 billion to $199.0 billion and operating income of $20.0 billion to $24.0 billion still looks supportive. AWS growth, retail efficiency, and ad leverage are still pointing the right way.
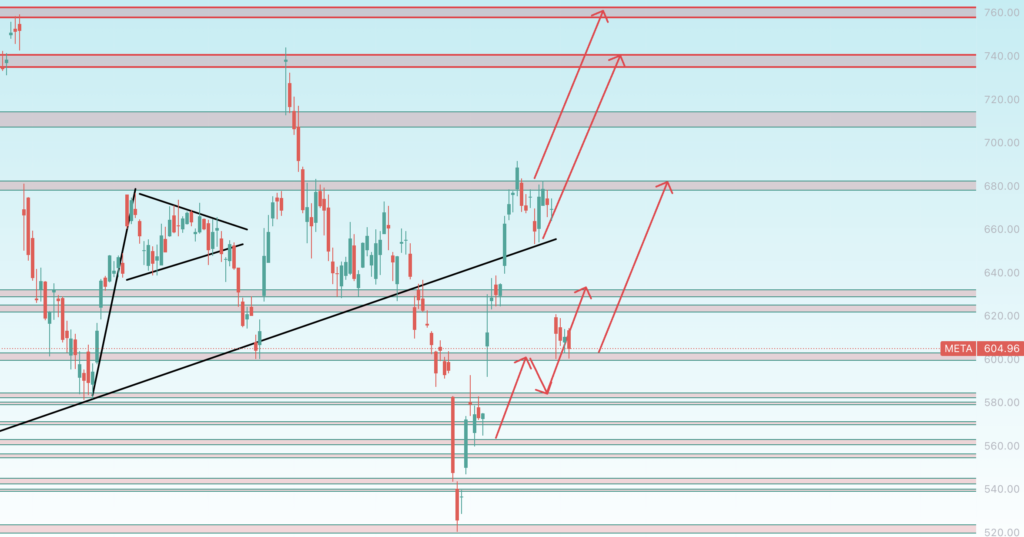
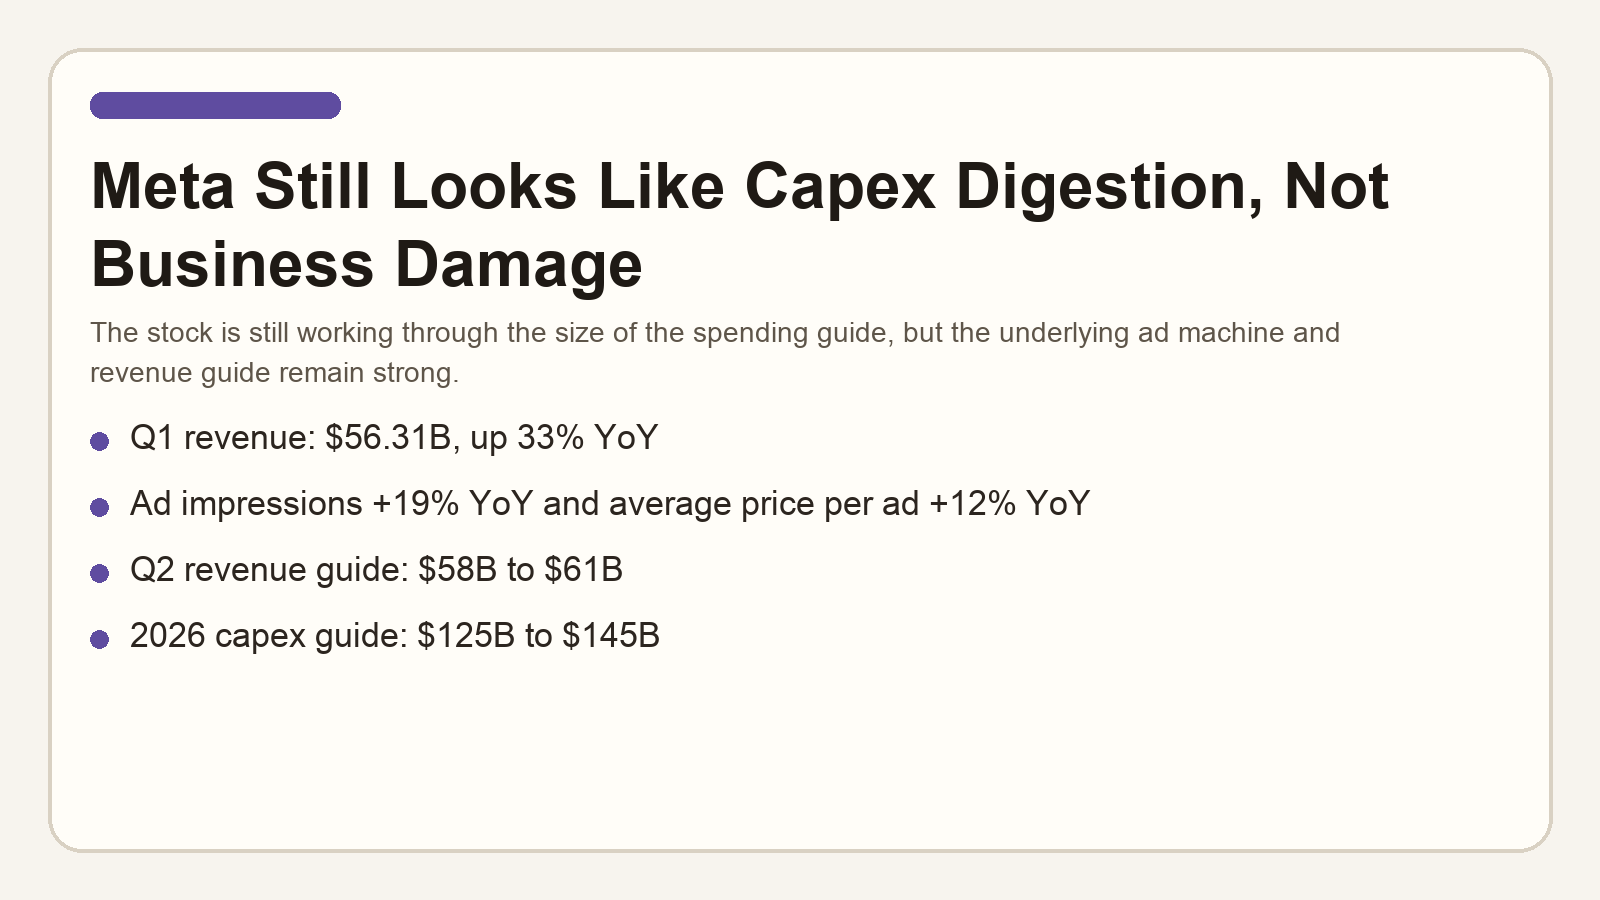
META remains a big opportunity
META still looks more like opportunity than failure to me. At the Tuesday, May 5, 2026 close, META finished at $604.96 versus Monday’s $610.41 close, down 0.89%. That is not amazing price action, but it still looks more like capex digestion and post-earnings re-rating than like the business actually rolling over.
The underlying quarter was still very strong. Meta reported Q1 revenue of $56.31 billion, up 33% year over year, with ad impressions up 19% and average price per ad up 12%. The company then guided Q2 revenue to $58 billion to $61 billion. The stock got hit because capex is now expected at $125 billion to $145 billion for 2026, but to me that still looks like investment into strength rather than evidence that monetization is failing.
MSFT
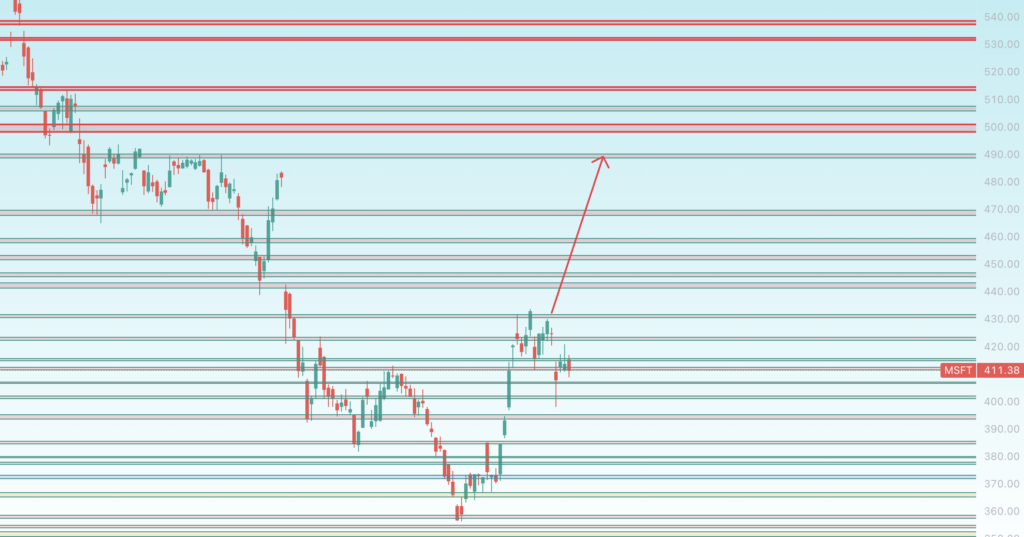
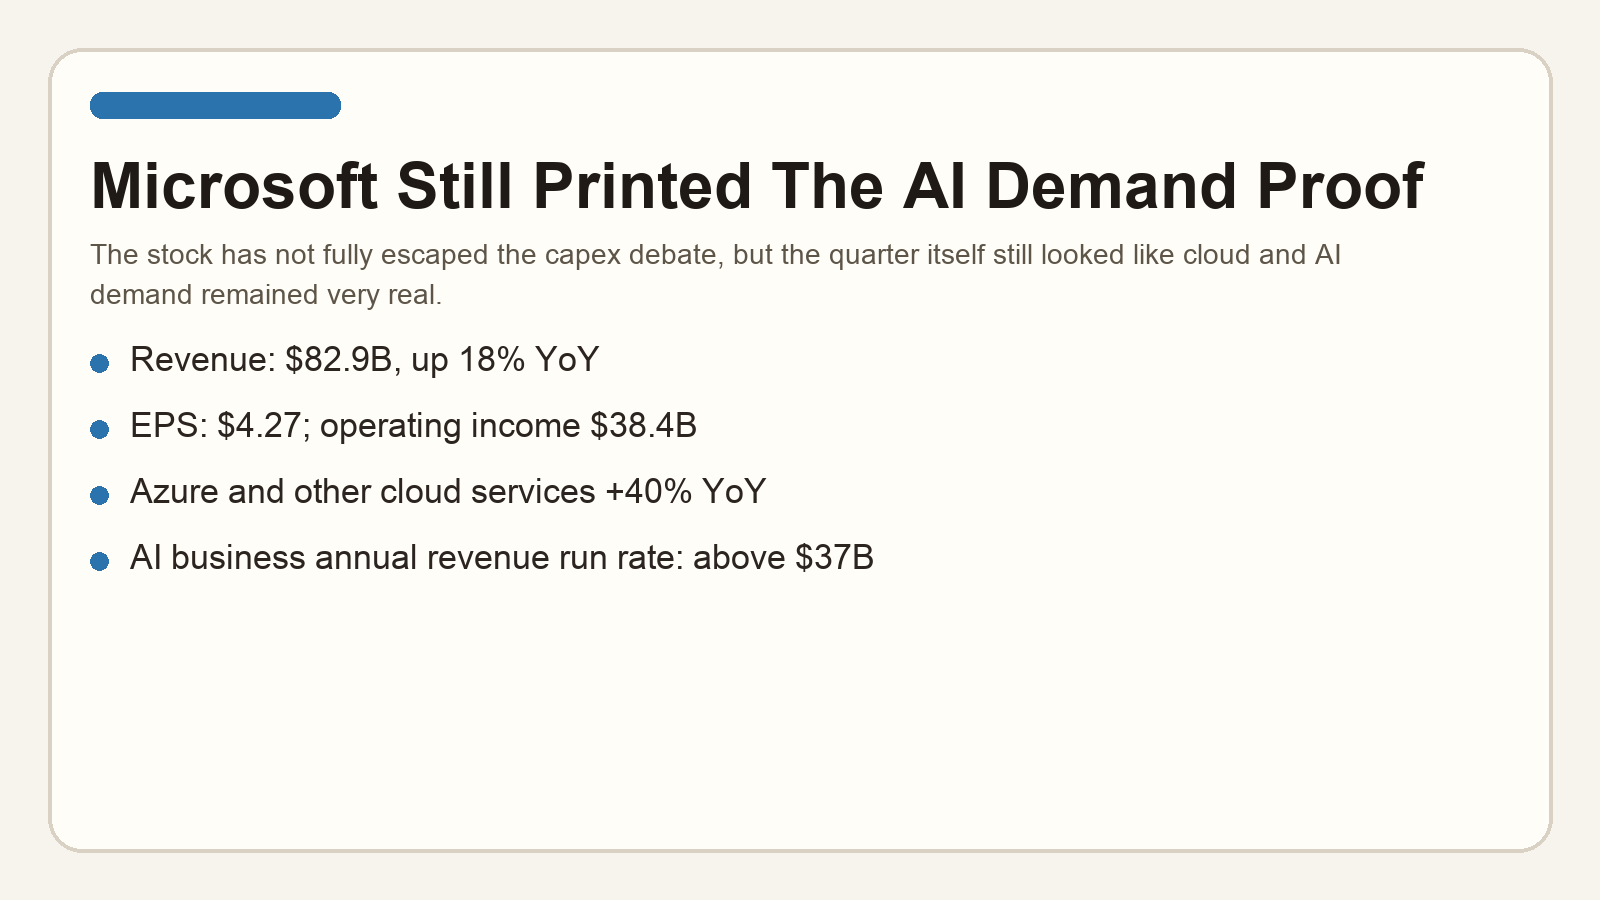
Microsoft still looks cheap relative to what the quarter actually said. At the Tuesday, May 5, 2026 close, MSFT finished at $411.38 versus Monday’s $413.62 close, down 0.54%. But I still do not think that price action invalidates the strength in the business.
The quarter itself still looked bullish. Microsoft reported revenue of $82.9 billion, up 18%, operating income of $38.4 billion, and EPS of $4.27. Azure and other cloud services grew 40%, and management said the AI business annual revenue run rate has already topped $37 billion. If the stock needs a beat-and-absorb phase because investors are nervous about capex, that is still very different from the business rolling over.
NVDA remains at a good spot for accumulation
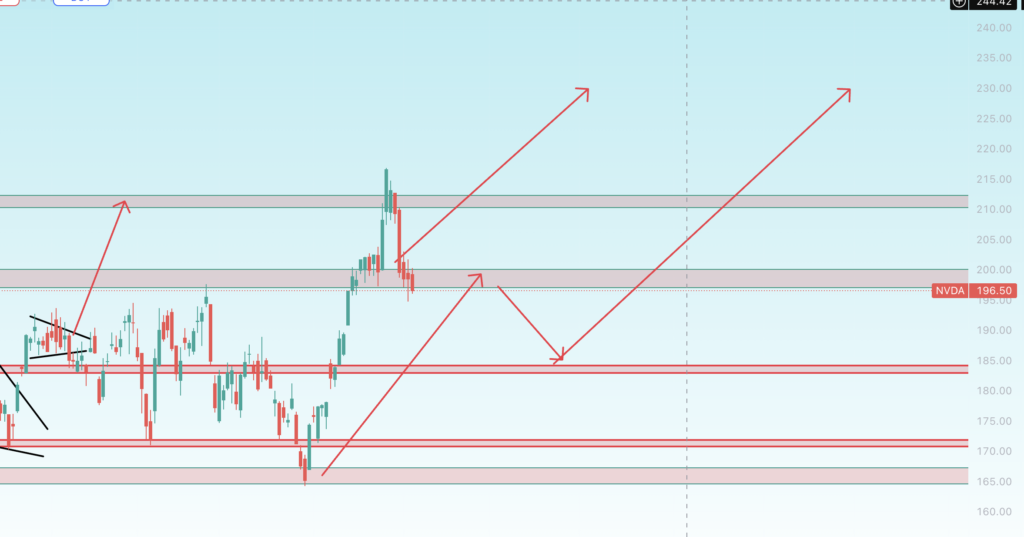
NVDA is still the cleanest AI beta read-through in the group. At the Tuesday, May 5, 2026 close, NVDA finished at $196.50 versus Monday’s $198.48 close, down 1.00%. That is not ideal near term, but it still came inside a market that was re-pricing how much hyperscalers are willing to spend.
I still lean bullish on that setup. Microsoft just showed Azure growth of 40% and an AI revenue run rate above $37 billion. Meta just raised its 2026 capex range to $125 billion to $145 billion. Amazon just grew AWS 28% to $37.6 billion and guided another strong quarter. If hyperscalers are still spending this aggressively and monetization is still coming through, NVIDIA still looks like setup rather than the start of an unwind.
Key catalysts from here
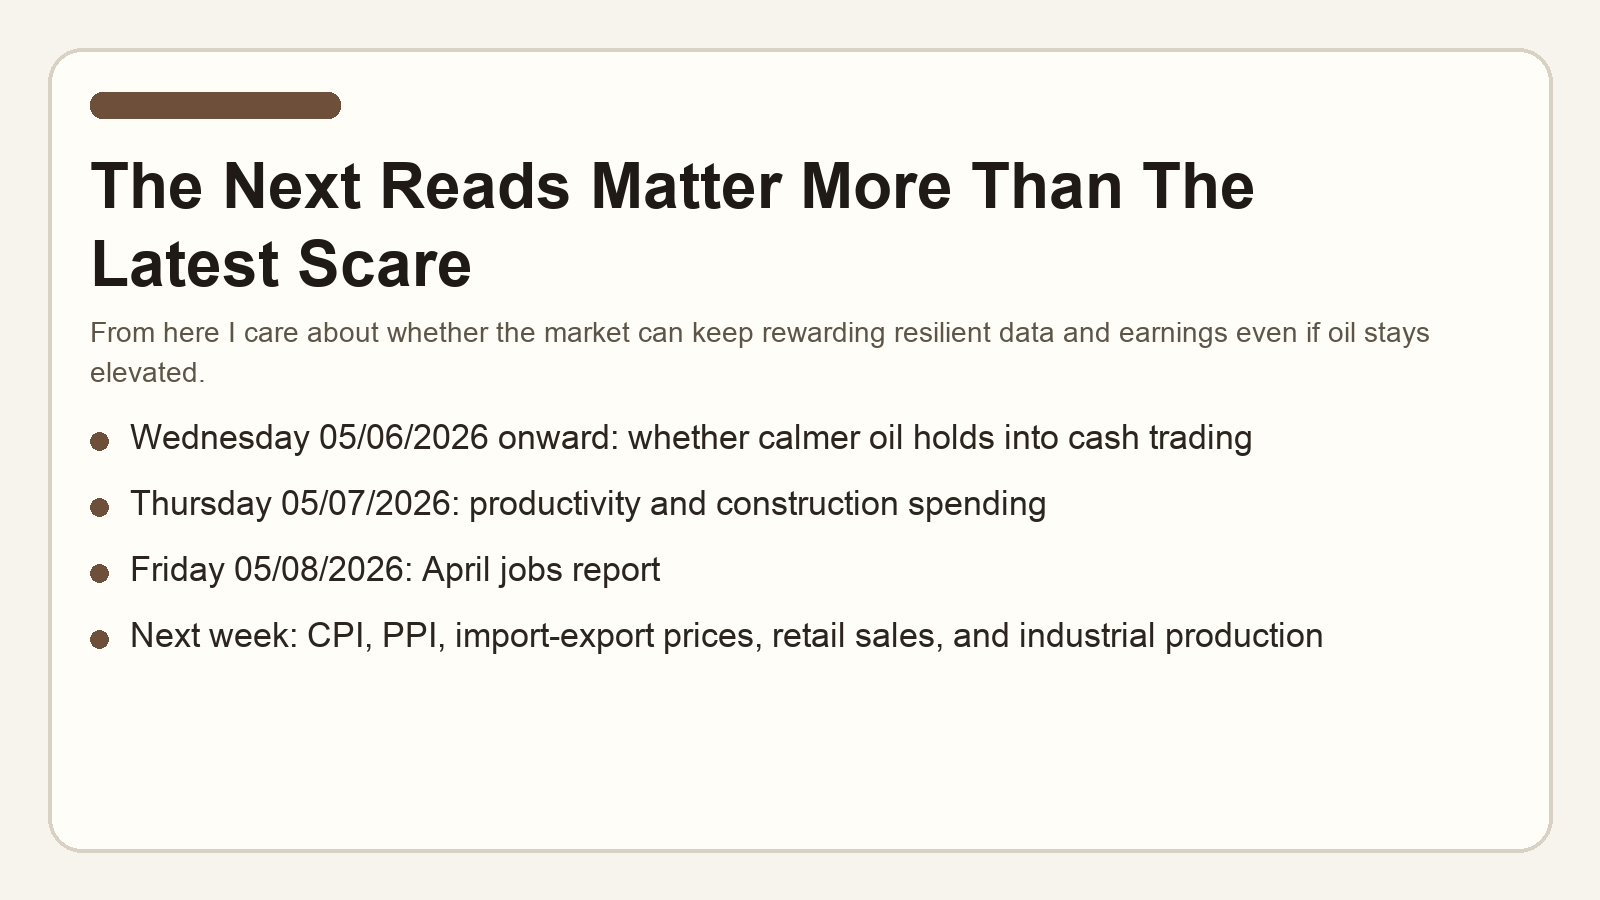
From here I care about four things most. First, whether the calmer overnight oil setup can hold once the next cash session opens. Second, whether Thursday’s productivity and construction data keep the resilient-growth story intact. Third, whether Friday’s jobs report confirms that Tuesday’s firmer labor readings were not just a one-off. Fourth, whether next week’s inflation and retail-sales prints let the market keep focusing on earnings and AI spend instead of forcing another inflation scare. If those pieces land cleanly, I still think the higher-probability move is up.
Upcoming key events and dates
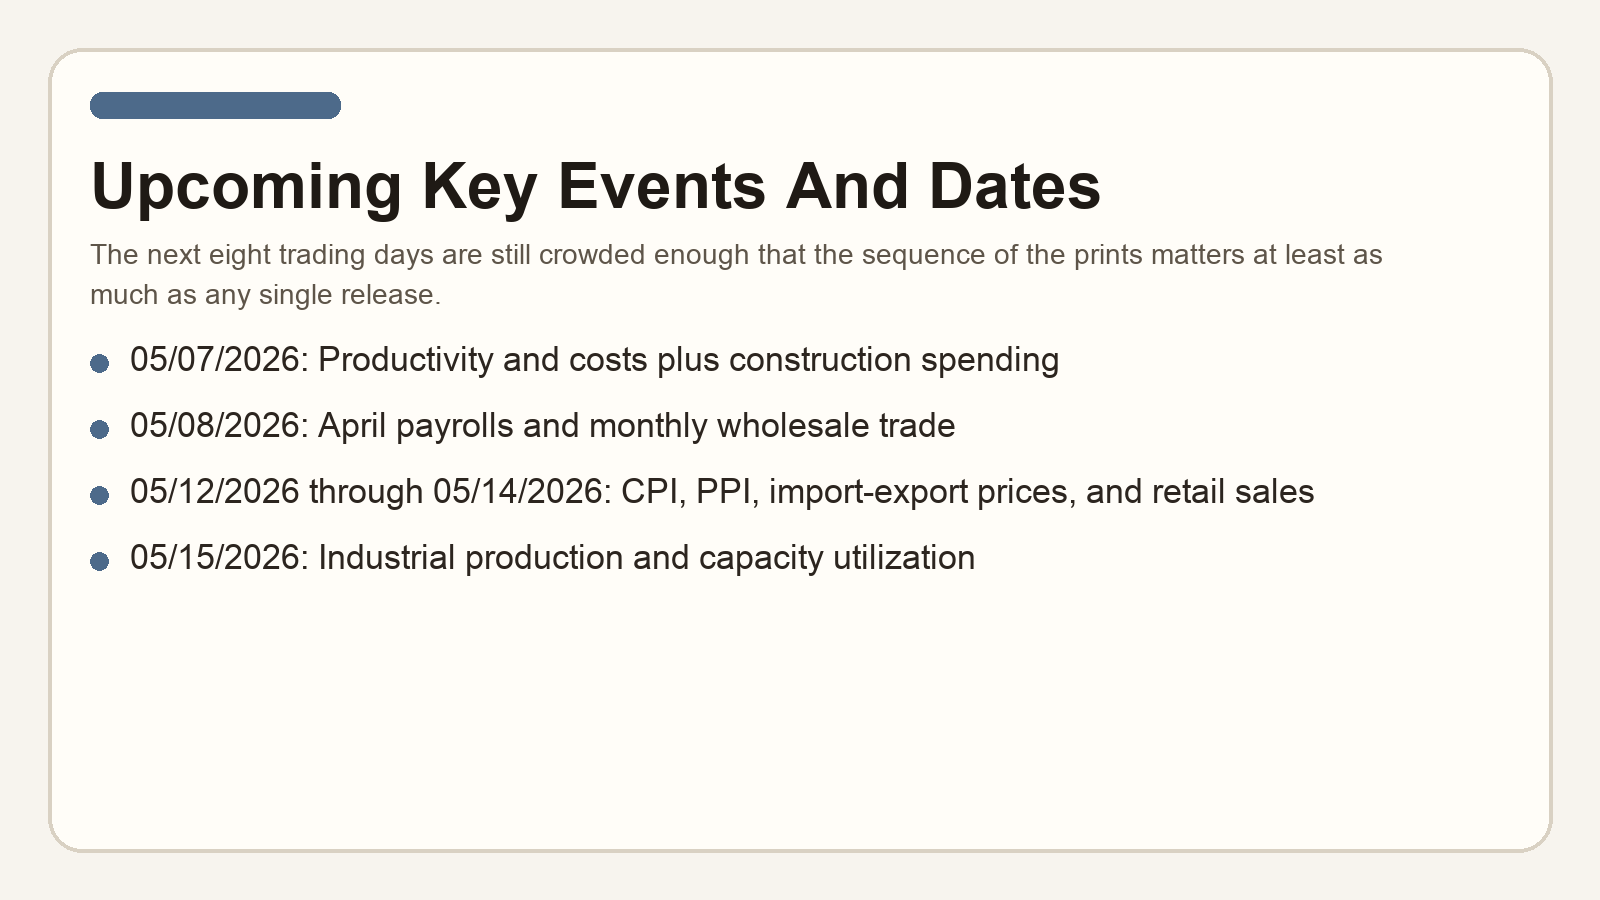
- 05/07/2026 – Productivity and Costs for Q1 2026, 8:30 a.m. ET
- 05/07/2026 – Construction Spending (Construction Put in Place) for March 2026, 10:00 a.m. ET
- 05/08/2026 – Employment Situation for April 2026, 8:30 a.m. ET
- 05/08/2026 – Monthly Wholesale Trade: Sales and Inventories for March 2026, 10:00 a.m. ET
- 05/12/2026 – Consumer Price Index for April 2026, 8:30 a.m. ET
- 05/13/2026 – Producer Price Index for April 2026, 8:30 a.m. ET
- 05/14/2026 – U.S. Import and Export Price Indexes for April 2026, 8:30 a.m. ET
- 05/14/2026 – Advance Monthly Sales for Retail and Food Services for April 2026, 8:30 a.m. ET
- 05/15/2026 – Industrial Production and Capacity Utilization for April 2026, 9:15 a.m. ET
Bottom line: Friday 05/01/2026, Monday 05/04/2026, and Tuesday 05/05/2026 were exactly the kind of back-to-back tests that can expose a weak rally. Instead, the market extended on Friday, absorbed the oil shock on Monday, and then pushed back to another record close on Tuesday. As of Wednesday, May 6, 2026 at 1:30 a.m. ET, the setup still looked more like follow-through than failure. I have held tight, remain very long overall, and I am still willing to re-add more leverage on a deeper dip.
Disclaimer: The information provided in this post is for educational and informational purposes only and does not constitute financial advice, investment advice, trading advice, or any other form of professional advice. The author is not a registered investment advisor, broker-dealer, or financial planner. No content published here should be interpreted as a recommendation to buy, sell, or hold any security or financial instrument.
All investments and trading strategies involve risk, including the possible loss of principal. Past performance is not indicative of future results. You should conduct your own research and consult with a licensed financial professional before making any investment decisions. The author expressly disclaims any liability for any loss or damage arising from reliance on the information contained herein.